I propose a cap-axis integral diagnostic for factor-model evaluation. Low-dimensional factor models can improve the maximum-Sharpe frontier while leaving zero-alpha violations on economically fixed subspaces. The diagnostic studies one such subspace by lifting pricing errors into a bridge-alpha curve along the market-capitalization rank axis. Under an aggregate-market gate, a zero curve is equivalent to pricing the market's internal cap-rank subspace. In 1967-2024 CRSP data, q5's daily negative bridge attenuates under lead-lag correction, while Fama-French and Carhart bridges are more visible monthly. Across 154 factors, the cap-axis norm is distinct from Sharpe gain and size exposure.
We estimate Kyle's (1985) price-impact coefficient $\lambda$ directly from daily equity order flow and test its ability to forecast the cross-section of subsequent stock returns. Using CRSP data from 2020 to 2025, we construct firm-month measures of signed order flow and two estimators of $\hat\lambda_{it}$: a within-month price-impact regression and an Amihud-style ratio. Signed order flow strongly predicts contemporaneous and one-month-ahead returns, while volume volatility predicts lower subsequent returns, consistent with widening price impact degrading price discovery. Fama-MacBeth regressions confirm that our order-flow signal carries significant cross-sectional return information after Newey--West adjustment. Theoretically, we resolve the liquidity premium puzzle of Constantinides (1986) through an adverse-selection mechanism: low order flow widens $\lambda$ and depresses prices today; subsequent normalization restores prices, generating the illiquidity premium without risk-based compensation.
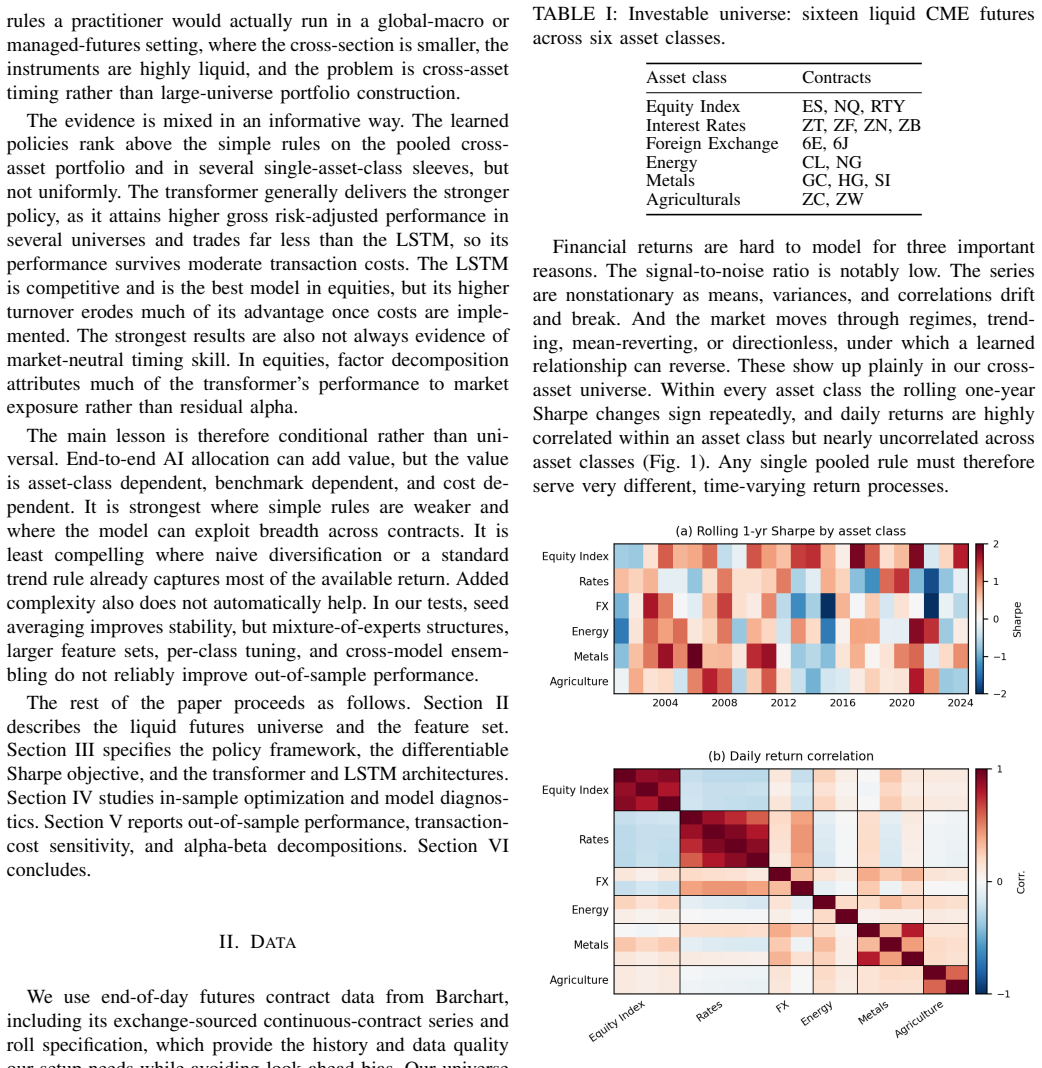
Timing-based tilts across asset classes can drive much of the risk and return of a diversified cross-asset portfolio. The standard approach forecasts returns and then optimizes weights. We instead study an end-to-end AI-based policy that maps market states directly to portfolio weights, and we then ask when this one-step modeling approach outperforms simple rules-based strategies. We train these policies on the sixteen most liquid CME futures, where an edge is unlikely to be due to illiquidity, using a differentiable Sharpe ratio loss function, and we benchmark them against equal weighting, risk parity, and time-series momentum. The learned policies rank above the rules on the pooled cross-asset portfolio and in several sub-asset classes, but not uniformly. In gross terms, an LSTM and a transformer-based architecture perform comparably out-of-sample, but diverge when we consider transaction costs. The transformer generates the stronger learned policy, trades far less than the LSTM, and matches or exceeds equal weighting through moderate cost.
Extreme events in financial systems, often captured by indicators such as volatility, remain difficult to identify close to their onset. Volatility shares many statistical properties with other natural, complex systems which experience extreme events, which we explore in this manuscript. We extend the analogy between rogue waves in optical and hydrodynamical systems to financial volatility by identifying rogue-wave-like peaks with similar statistical properties. We use a Schr\"odinger equation where the potential follows the shape of a Kerr nonlinearity to examine the properties of financial volatility indices within a moving time window. We see evidence of Anderson localisation as a rogue peak approaches in the VIX, and show that the numerical gradient of the system's minimum eigenvalue reliably spikes at the onset of an extreme event. We adapt our methodology to simulate the real-time arrival of data, and show that all but one of the VIX's major peaks can be detected given a reasonable amount of history. We then perform two out-of-sample tests, one for the VXO index, and one for the VSTOXX index, and successfully replicate our initial results, identifying all but one major peak (87.5% or 7/8) in both cases. This method of analysis shows considerable promise as a tool for identifying potential financial crises, aiding in their mitigation.
GAMLSS/ZAGA model of adjusted information ratios shows SVMP and buy-and-hold superiority depends on volatility and momentum levels.
abstractclick to expand
Conventional comparisons of algorithmic trading strategies reduce each performance metric to a single number over the full backtest horizon, thereby discarding information about how performance varies with market conditions. This paper proposes a distributional framework that addresses this shortcoming. A walk-forward backtest of 146 out-of-sample folds on the S&P 500 (2002--2025) is used to compute the Adjusted Information Ratio ($IR^{\ast}$) for a polynomial Support Vector Machine strategy (SVMP) and a buy-and-hold benchmark (BH) in each fold. The resulting $IR^{\ast}$ sequences are modelled jointly via a Generalised Additive Model for Location, Scale and Shape (GAMLSS) with a Zero-Adjusted Gamma (ZAGA) response, with distributional parameters conditioned on market regime covariates: realised volatility and cumulative market momentum. Strategy comparison is conducted through (i) regime-specific differences in expected $IR^{\ast}$ ($\Delta E$) and its variance ($\Delta Var$), derived analytically from the fitted ZAGA parameters, and (ii) parametric bootstrap tests of three null hypotheses concerning $E(IR^{\ast})$, $Var(IR^{\ast})$, and their ratio, evaluated at six representative market regimes. The results demonstrate that the dominance relationship between SVMP and BH is conditional on market regime. The proposed GAMLSS/ZAGA framework constitutes a methodologically rigorous and practically interpretable alternative to conventional strategy evaluation.
In a deep forecasting pipeline for fat-tailed financial returns at short horizons, which matters more - the backbone architecture or the output head? We compare four modern backbones (TimesNet, DLinear, N-BEATS, iTransformer) under three output heads: a point head, a single-Gaussian density head, and a Gaussian mixture density head with K=4 components. On S and P 500 monthly log-returns (1871-2023) under anchored walk-forward validation, the three heads form a strict gradient: switching from point to Gaussian improves CRPS by about 1.3 percent; switching from Gaussian to mixture adds a further about 2.4 percent. Switching between backbones, in contrast, changes CRPS by less than 1.5 percent on the point-head row and on the backbone-mean axis; density-head backbone spread is larger (up to 5.1 percent on the h=1 Gaussian row, driven by N-BEATS) but the head gradient (3.7 percentage points) still dominates. The Model Confidence Set on squared errors does not exclude any of the 12 variants at the 5 percent level: the head separates them only on distributional metrics (CRPS, pinball, coverage), not on squared error. The mixture head incremental value over a single Gaussian is largest in the highest-volatility regimes (13.9 percent in 1970s stagflation at h=12), confirming the mixture captures tail risk beyond what a unimodal Gaussian can express. The picture is horizon-dependent: the head dominates at short horizons, but at long horizons (h >= 6) the backbone re-takes the lead - an h-split we document against classical baselines (section 5.1). We conclude that on fat-tailed returns at short horizons, the head dominates the backbone, and the mixture distribution adds genuine value over a single Gaussian during crisis periods when risk-management decisions actually matter.
Testing self-similarity in fractional processes from a single observed trajectory is difficult under long-range dependence, because the associated Kolmogorov--Smirnov (KS) statistic undergoes a phase transition when $H>1/2$. In this regime, the classical limit collapses to a non-functional absolute Gaussian law and finite-sample convergence becomes severely distorted. This paper introduces a regime-adaptive KS/GL--KS framework based on the discrete Gr\"{u}nwald--Letnikov (GL) fractional derivative. The GL filter removes the low-frequency long-memory singularity while preserving the finite-dimensional $H$-self-similarity needed for distributional identification. We derive the filtered empirical-process limit, prove consistency and local asymptotic behavior of the resulting Hurst estimator, and validate the method through Monte Carlo simulations. Financial applications to realized volatility and equity index prices show how the procedure detects rough volatility and persistent, anti-persistent, or efficient market states.
Cryptocurrency price prediction is a significant challenge in quantitative investment. In recent years, time series models have made significant progress in financial forecasting tasks, especially in the stock market. Despite the growing performance over the past few years, we question the validity of this line of research in cryptocurrency prediction. Specifically, time series models (e.g., LSTM, GRU, and Transformers) are effective at extracting temporal relationships in stock market data. However, in pure price-based cryptocurrency prediction, facing data with extreme volatility and wild swings, time series models have difficulty learning effective information. To validate our claim, we propose CryptoGAT, a lightweight Graph Attention Network that recasts cryptocurrency pure price prediction as a cross-asset graph problem rather than a temporal modeling task. Extensive experiments on real cryptocurrency benchmarks demonstrate that our proposed CryptoGAT outperforms various state-of-the-art forecasting methods with a notable margin. Moreover, we conduct comprehensive empirical studies to explore the fundamental differences exposed by time series models in stock and cryptocurrency prediction: differences in predictability of the signal and cross-asset dependencies. This finding opens up new research directions for the cryptocurrency pure price prediction task and inspires further graph-based exploration in the field. The source code is available at https://github.com/FanBroWell/CryptoGAT
We study whether a scaling-law-style inference-compute frontier appears in limit order book prediction. Using FI-2010 and a suite of models ranging from small decision trees to neural LOB architectures, we find that the realized empirical frontier of predictive loss versus structural forward work is well summarized by a power law. In particular, with MLPLOB held out as an architecture family, a power-law fit to the low- and mid-compute non-MLPLOB frontier extrapolates across multiple orders of magnitude and attains $R^2=0.941$ on the excluded high-compute MLPLOB target frontier.
A similar exercise in latency space gives substantially weaker results, showing that latency is not merely noisy compute. We use this gap to motivate FastBiNLOB, a dense axis-separable LOB mixer built from hardware-friendly temporal and feature mixing operations. In a five-seed experiment, FastBiNLOB exceeds the published $y_{10}$ and $y_{100}$ macro-F1 targets at notably lower latency than existing published SOTA architectures.
Financial fraud detection in digital banking requires reasoning over multiple heterogeneous event streams -- transactions, login sessions, risk signals -- that individually appear benign but collectively reveal fraudulent patterns. We propose the Multi-Stream Fraud Transformer (MSFT), a unified architecture that encodes each event stream with independent Transformer encoders and fuses their representations through configurable mechanisms. We conduct a systematic ablation study comparing five fusion strategies: concatenation, gated fusion, time-aware positional encoding, cross-stream attention, and a full combination. On a large-scale dataset (10M users, 1.5% fraud rate) with 85M parameter models, we demonstrate that (1) sequence models significantly outperform gradient-boosted trees operating on aggregated features (0.74 vs. 0.99 AUROC), (2) per-stream encoding is essential -- a single-stream Transformer baseline with matched parameter budget reaches only 0.82 AUROC, an 18-point gap that confirms the multi-stream inductive bias is necessary, (3) time-aware positional encoding achieves the highest discrimination (0.9961 AUROC), (4) gated fusion yields the best precision (0.989) suitable for production deployment, and (5) the risk event stream provides the strongest individual signal contribution. We further validate on proprietary production data from a digital banking platform, showing over 22% relative AUROC improvement over the XGBoost baseline.
We test the square-root law (SRL) of market impact on a single U.S. large-capitalisation equity, Apple Inc. (AAPL), using the full Nasdaq TotalView-ITCH market-by-order feed over 178 trading days (2 December 2024 -- 19 August 2025; ~0.5 billion events). Without broker-tagged parent orders, we reconstruct metaorders from the anonymous tape and calibrate impact as $I/\sigma_D = c\,(Q/V_D)^{1/2}$ with the exponent fixed at the universal value $1/2$. We find $c_{\rm raw} = 0.69$ (bias-corrected $c_{\rm eff} = 0.34$), conditional impact tracking $Q^{1/2}$, and a size-distribution tail exponent $\beta = 1.54 \pm 0.15$ -- both consistent with the worldwide cross-section. A direct model comparison decisively prefers the square-root form over linear ($\Delta{\rm AIC}=22$) and logarithmic impact, and the prefactor holds ($c_{\rm raw} \in [0.63, 0.77]$) across every reconstruction setting. Two structural tests confirm the impact is genuine: shuffling trade signs collapses directional impact to chance (86% to 51%); and scrambling event chronology destroys the SRL (0 of 80 calibrations remain viable). The underlying order flow is long-memory ($\gamma=0.66$) while the price stays diffusive (Hurst 0.49) -- the two ingredients of the universality theories. The prefactor is stable across 32 weekly walk-forward re-calibrations. To our knowledge this is the first confirmation of the square-root law on a U.S. equity derived purely from anonymous order flow, without broker-tagged parent orders.
Synthetic generators of daily equity returns let practitioners stress test, backtest, and design scenarios that a single realized market history cannot supply, but only if the generator reproduces the stylized facts of real returns: heavy tails, negligible linear autocorrelation, and slow decay of the absolute-return autocorrelation. Hidden Markov models with few Gaussian states were long thought unable to reproduce that slow decay, and the standard fix was to abandon them for more complex hidden semi-Markov models. We revisit this issue with a continuous hidden Markov model whose regime chain governs the autocorrelation while per-regime densities govern the marginal, separating the temporal and distributional sides of the original failure. A unified expectation-maximization framework fits Gaussian, Student-t, Laplace, and generalized-error emissions under shared forward-backward recursions and quantile-based initialization, and a spectral identity bounds the number of decay modes by the rank of the centred transition matrix. Across SPY walk-forward folds, a sector-balanced 30-ticker panel, a CRSP cross-decade transfer, and a six-asset basket, that bound was not binding once a few states were used: heavy-tailed marginals, not additional decay modes, closed most of the fit gap, recovering volatility clustering above the i.i.d. baseline and narrowing the kurtosis gap without a tuning hyperparameter. The original failure is therefore distributional, not temporal. On daily US equities, a simple, interpretable Markov model suffices, and unlike a bootstrap or semi-Markov fit that wins only on a single-window fit, the fitted model also yields a regime-conditional Value-at-Risk that passes a joint conditional-coverage test and a copula that reproduces cross-asset correlations: one interpretable generator serving both path simulation and downstream risk and portfolio tasks.
Ethereum's beacon chain hosts over 920,000 active validators, a number inflated by the legacy 32 ETH stake cap. The Pectra upgrade (May 2025) addresses this by introducing 0x02 compounding validators, raising the maximum stake per validator from 32 to 2,048 ETH and enabling automatic reward reinvestment. This paper examines how compounding affects consensus-layer rewards, whether higher balances provide execution-layer advantages, and whether the APR uplift justifies migration for different staker types. We analyse adoption patterns across solo stakers and staking providers, investigate the role of consolidation (merging multiple 32 ETH validators into one) in early migration, and identify barriers slowing the transition. Through simulation, we find that compounding provides roughly +5% relative consensus-layer APR uplift for small balances, diminishing to under 1% for large staking providers. Empirical analysis of all active beacon chain validators shows 0x02 validators achieving modestly higher median CL APR. Solo stakers show higher relative adoption but face operational barriers, whilst providers cite infrastructure costs and protocol constraints. The results suggest that without improved reward accessibility and stronger economic incentives, 0x02 migration will remain gradual despite its network efficiency benefits.
Forecasting benchmarks for retrieval-augmented LLMs routinely confound model capability with information leakage: features labeled with a target's timestamp are often not observable at the system's decision time. We study leakage-controlled equity factor ranking with a retrieval-augmented 7B open-source LLM forecaster. At each month-end from 2023-04 to 2026-03, the forecaster observes only decision-time information: lag-shifted FRED macro variables, recent macro-event summaries, and the Cleveland Fed's archived daily CPI nowcast for unreleased current-month inflation. A macro-analog retrieval module selects historical states, a critic LLM compresses them into one tactical rule, and an actor LLM maps the current state and recent rules into scores for seven U.S. equity style factors. The full pipeline obtains a median monthly Spearman rank IC of +0.154, with positive means across three non-overlapping contiguous 12-month subwindows; the mean IC remains statistically underpowered, with a bootstrap 95% confidence interval that includes zero. Non-LLM baselines under the same decision-time constraint demonstrate that a kNN macro-analog model recovers a comparable median IC, indicating that real-time inflation information and macro-similar retrieval explain much of the median signal. The LLM pipeline retains higher mean IC and a stronger long-short allocation sanity check, suggesting that any marginal benefit is concentrated in the extreme rankings that drive long-short portfolio formation. A descriptive audit of the 36 critic rules and per-month case studies appears in the appendix.
We introduce the zero-one censored transformed normal (ZOC-TN) model for proportional responses with potential probability mass at the boundaries 0 and 1. The model combines a censored Gaussian variable with a two-parameter affine-logit transformation on the interior (0,1). We characterize the transformation parameters, establish large-sample properties, and relate the affine-logit specification to broader classes of interior distributions. Theoretical and experimental results demonstrate that the proposed model can capture a wider range of qualitative density shapes than several benchmark models while remaining parsimonious, computationally efficient, and numerically stable. Furthermore, the ZOC-TN model can be extended (i) to account for nonlinearities and interactions in a tree-boosting machine learning framework and (ii) to explicitly model residual spatio-temporal variability. We apply the ZOC-TN model to loss given default (LGD) modeling for a large dataset of U.S. residential mortgages and compare it to multiple benchmark models. We find that a tree-boosted ZOC-TN model with a spatio-temporal frailty Gaussian process delivers the strongest out-of-sample performance, indicating that mortgage losses are shaped by nonlinear covariate effects and by unaccounted-for space-time variation.
We forecast future volatilities and correlations of financial markets based on the current trends in these markets. This complements previous work that models future expected returns by a cubic polynomial of the current trend strength. Empirically, we observe that volatilities and correlations tend to increase day after day in times of strong up- or down-trends. This effect is particularly pronounced in down-trends. It can be accurately quantified by quadratic polynomials of today's trend strengths, which refine common mean-reversion models of volatilities and correlations. Our results improve the prediction of market risk by accounting for market trends. They also support a recent proposal to model financial markets by a lattice gas near its critical point.
We analyze distributions of historic S&P500 multi-day returns, for the number of days of accumulation from 20 to 120. With the increase of the number of days of accumulation, we observe clear tempering of power-law tails toward a seemingly finite value. To explain this phenomenon, we employ a model that produces a "capped Inverse Gamma" stationary (steady-state) distribution for stochastic volatility which, in turn, produces a "tempered Student-t" distribution for returns. We then employ Jones-Faddy-like symmetry breaking mechanism that produces a "tempered Skew-t" distribution. This distribution provides rather good fits to the distributions of accumulated multi-day S&P500 returns, which exhibit symmetry breaking between gains and losses -- as reflected by positive mean and negative skew. Tempered Skew-t fits are also consistent with near perfect linear dependence on the number of days of accumulation of the mean values and, even more so, of the variances (mean squared realized volatility) of the distributions.
The composite likelihood method reduces the computational cost of parameter estimation in time series by considering several subsets of observations instead of all observations at once. The asymptotic properties of this method are related to the Godambe information, an extension of the Fisher information that accounts for the dependence between subsets of observations. We aim to apply this method to linear Gaussian models, in particular fractional Brownian motion and fractional Gaussian noise. We derive theoretical expressions for their Fisher information and their Godambe information and deduce a subset selection design that sequentially maximizes the Godambe information. The size of the subsets then allows us to control the trade-off between estimation accuracy and computational cost. Through simulations, we compare this method with the method of moments and maximum likelihood estimation, and we apply it to real data, namely volatility series of a stock index and a wind speed time series.
Parametric dynamics plus residual resampling produces coherent interest-rate trajectories unlike pure distribution-preserving methods.
abstractclick to expand
Generating stochastic trajectories for asset classes is an increasingly relevant task in quantitative finance. Traditional approaches, such as the stationary bootstrap, preserve by construction the empirical distribution of asset-class returns, but do not ensure that each individual simulated path is economically realistic: scenarios may be valid in distribution while single trajectories fail to represent plausible states of the world. To address this limitation, we review semiparametric simulation methodologies that combine a parametric structure, which enforces realistic dynamics, with the resampling of model residuals, which preserves the stochastic component observed in historical data. The issue is particularly acute for interest rates, where direct resampling of rate changes may produce implausible yield-curve evolutions despite correct distributional properties. Our empirical analysis shows the effectiveness of semiparametric bootstrap methods based on autoregressive or mean-reverting specifications. In the fixed-income setting, combining these methods with fully parametric term-structure models yields more coherent and realistic simulations of yield-curve dynamics.
This paper develops a methodological framework for reverse stress testing (RST) in which a multivariate stress scenario, coherent with the empirical dependence structure of a market, is reconstructed from a single exogenous shock prescribed on one asset class. The problem is formulated as the maximisation of the conditional density given the imposed shock, and is solved under three progressively weaker distributional assumptions. In the parametric setting, joint Gaussianity of the returns yields a closed-form modal scenario coinciding with the conditional mean of the non-shocked components. In the semiparametric setting, the modal scenario is estimated nonparametrically through the empirical likelihood methodology and the surrounding stressed trajectories are generated via a Gaussian or Student-t local sampling scheme. In the fully nonparametric setting, stressed trajectories are obtained by inverse-distance resampling of the historical observations within a Mahalanobis neighbourhood of the estimated scenario. The three variants are validated on real market data. The simulated scenarios prove to be economically coherent and capable of reproducing the standard risk-reward asymmetry observed in stressed market regimes.
Exact identity under i.i.d. costs and mean-unbiased Markov policies yields model-free audit for sequential decisions
abstractclick to expand
We study the problem of auditing a black-box algorithmic decision-maker from observable inputs and outputs alone. Our main result is an exact decomposition: under precisely characterized conditions, the cumulative \emph{regret} of a dynamic policy equals the sum of per-period covariances between the cost vector and the policy's decision. This extends the single-period identity of Aldridge~(2026) to the full multi-period setting of stochastic dynamic programming.
We prove the identity holds exactly under i.i.d. costs and mean-unbiased Markov policies, derive closed-form bias corrections for non-stationary and time-varying cases, and establish the discounted-horizon analog. A Bellman recursion for the covariance regret functional connects the result to standard reinforcement learning algorithms; for rolling-window policies, the estimation-error bias is $O(d/w)$.
The decomposition has direct implications for algorithmic auditing in strategic environments: in platform mechanism design, it provides a welfare-based audit metric without access to the agent's private type; in repeated games, covariance reduction is a sufficient condition for policy improvement; in procurement and ad auctions, the bias correction quantifies welfare loss from strategic misreporting. The associated trajectory estimator is consistent, asymptotically normal with HAC variance, and computable in $O(T \cdot nd)$ time. This makes the proposed approach a tractable, model-free audit tool for platform mechanisms, algorithmic portfolio strategies, and any sequential decision system subject to external performance review.
History of these scores shows gradual impact, early reversal, and heavier weight on recent observations across assets and frequencies.
abstractclick to expand
Anomaly detection methods in financial time series score statistically unusual observations in observable data, not topologically misexpected persistent deviations in the latent structure of co-movement. This study constructs a stock-level topological anomaly score jointly conditioned on market-level topological structure and cross-sectional peer context, and tests whether its history carries predictive content for return curves. Intraday data for ten liquid S&P 500 constituents (April 2025--March 2026) are embedded via Takens delay embedding, graphed by BallMapper, and scored by three decoder-conditional variational autoencoder variants. Predictive content is assessed by penalised function-on-function regression and confirmed across all assets, intraday bar frequencies, and scoring variants, revealing a consistent temporal fingerprint -- gradual accumulation of return impact, a frequent early reversal of its direction, and broadly distributed predictive content weighted toward recent anomaly history. When the reversal occurs depends on market regime; how evenly the anomaly history contributes to prediction depends on bar frequency.
Rejection criteria net positive on 4874 observations but profits hinge on three trades
abstractclick to expand
This paper measures hour-of-day effects, filter precision, fragility, and realised yield in a 15-day paper-traded deployment of an autonomous memecoin trading system on Solana decentralised exchanges. The 190-trade sample (March 29 to April 12, 2026) shows a 40.5 percent win rate, mean per-trade return of +0.62 percent, cumulative +117.7 percent (net SOL +0.039), skewness -1.21, excess kurtosis 6.61. A Mann-Whitney U test of three poorest-performing UTC hours (2, 13, 23) against the others yields U = 1,274, p = 0.22; directional but not significant at n = 190. The three hours were selected in-sample, so the comparison is exploratory, not confirmatory. A parallel counterfactual rejection-tracking system collected 4,874 forward-sample observations across 184 distinct rejection events. Of those events, 17.9 percent reached a 50 percent drawdown from reference within 24 hours; 26.0 percent of forward samples recorded the rejected token below half-reference. The filter stack avoided these realised drawdowns: evidence that the rejection criteria are net-positive against forward-market outcomes. Fragility is the principal caveat. Removing the top three trades (1.6 percent of sample) flips cumulative return unprofitable. Profitability rests on a small number of large winners and is structurally fragile. The dataset and audit script are deposited under CC-BY-4.0 (Zenodo DOI 10.5281/zenodo.20043302).
Method records price and liquidity of filtered candidates to judge trading filters against observed results rather than backtests.
abstractclick to expand
Algorithmic trading systems on decentralised exchanges (DEXs) reject most candidate tokens they evaluate. The counterfactual outcome of rejected candidates (what would have happened had the system entered) is rarely measured. This paper introduces Post-Rejection Follow-up Sampling (PRFS). A separate tracking subsystem samples each rejected token's price and liquidity at a configurable cadence, over a horizon of up to twenty-four hours. PRFS produces the data needed to evaluate filter precision against actual market outcomes of rejected candidates, not against synthetic backtest reconstructions. The methodology, data architecture, and deposit format are described in Section III. The companion dataset contains 67,000 forward-outcome observation rows across 2,997 rejection events spanning 457 unique mints, collected over a continuous eight-day window (2026-04-10 to 2026-04-19, UTC). Approximately 55 percent of rejection events receive at least one forward observation; coverage at the mint level is complete. The principal binding constraint on downstream classification is per-event horizon density, not event-level coverage. PRFS is dataset-independent. It generalises to any algorithmic decision system in which rejections substantially outnumber executions.
Indonesian data across ten years shows linear methods suit taxonomy while flexible graphs expose cross-sector links such as commodities.
abstractclick to expand
The collective movement of stock prices harbors complex interdependencies that are conventionally simplified only through a linear lens. This paper explores computed structural network representations in the Indonesian capital market by testing the limits of Pearson correlation and Mutual Information (MI) in unveiling the spectral dynamics of the market. Across 2,328 rolling observation windows from 2015 to 2025, we examine 24 methodological configurations that combine three dependency estimators (Pearson, MI adaptive binning, and MI-kNN), two graph filtering schemes (Minimum Spanning Tree/MST and Planar Maximally Filtered Graph/PMFG), and four community decoders.
The empirical results unveil a fundamental reality: topological richness does not always resonate with sectoral classification precision. The Pearson, MST, and Infomap configuration is shown to remain the most robust foundation for recovering conventional sectoral taxonomy. Nevertheless, when deeper observation demands the exposition of local structures and the weave of heterogeneous communities, the architectural relaxation through PMFG demonstrates its superiority. In the realm of residual information detection, MI adaptive binning appears far more proportional than kNN; histogram-based regularization successfully tames empirical noise without sweeping away traces of non-linear dependency. Ultimately, the synergy of MI and PMFG is not positioned to dethrone the dominance of linear correlation, but rather to provide an essential analytical lens for excavating hidden economic sub-structures -- such as the cohesion of commodity regimes -- that have long transcended the rigid boundaries of the market's formal sectors.
While deep learning has excelled in various domains, its application to sequential decision-making in finance remains challenging due to the low Signal-to-Noise Ratio (SNR) and non-stationarity of financial data. Leveraging the reasoning capabilities of Large Language Models (LLMs), we propose \textbf{PandaAI}, a closed-loop neuro-symbolic LLM agent with market regime modeling and constrained alpha generation, which bridges general LLM reasoning with financial rigor and suppresses the financial toxicity of LLM-generated outputs. To bridge the gap between general linguistic capability and financial rigor, we fine-tune a domain-specific LLM. Furthermore, we integrate this LLM into a modular architecture and form a closed-loop system. Unlike traditional models that optimize isolated prediction metrics, \textbf{PandaAI} is designed as a neuro-symbolic agent that navigates the complex, real-world financial environment with explicit risk awareness. Extensive experiments on CSI 300 stock data show that \textbf{PandaAI} achieves a $18.2\%$ higher Rank IC and $25.7\%$ lower maximum drawdown than state-of-the-art time-series models. Our constrained LLM generation and dual-channel adaptation method provide a general paradigm for LLM deployment in high-stakes sequential decision-making scenarios.
Financial volatility exhibits substantial non-stationarity, making single-regime models inadequate for characterising changing market conditions. This paper proposes a triple-timeframe Markov-Switching GARCH (MS-GARCH) framework for volatility regime detection in EUR/USD across daily, four-hour, and hourly horizons. Three independent AR(1)-MS-GARCH models are estimated to capture macro, meso, and micro regime dynamics, while Filardo-style time-varying transition probabilities (TVTP) are incorporated at the shorter horizons through composite stress indicators. The resulting regime probabilities are combined through an outer-product construction into a 27-state cross-scale probability tensor. Using EUR/USD data from 2015-2025, the framework produces statistically distinct Calm, Turbulent, and Crisis regimes and achieves superior out-of-sample volatility forecasting performance relative to a conventional GARCH benchmark. The results suggest that volatility dynamics contain meaningful structure across multiple timescales and that modelling these scales separately provides a more informative representation of market conditions than a single-timescale approach.
Generating realistic financial time series is challenging as training data is often limited to a single historical path. With such scarce data, overfitting is hard to avoid, especially under adversarial training where a trained discriminator can memorize the training samples. To mitigate this, recent approaches train generators to minimize the discrepancy between untrained feature representations of real and generated time series. In these works, the feature maps are based on path signatures, which can fail to capture relevant time series properties at tractable truncation depths. In this work, we instead train generators by matching random convolutional features of real and generated time series. Existing random convolutional feature maps, such as Rocket and Hydra, have been shown to provide informative representations of real-world time series, but cannot supervise generative models because they are non-differentiable. We introduce SOCK (SOft Competing Kernels), a fully differentiable random convolutional feature map, suited to train generative time series models. We show that generators trained by matching random SOCK features consistently outperform signature and diffusion baselines across a wide range of small-sample financial datasets. We further demonstrate SOCK's expressiveness on two-sample hypothesis testing and time series classification tasks, where SOCK matches or outperforms existing unsupervised feature maps.
The surplus of a life insurance policy depends on both systematic changes in mortality risk and financial changes. We propose to decompose the surplus by the axiomatically justified IASU decomposition, which is a continuous time version of the Shapley value. However, life tables are not updated continuously, but rather, only once per year. In this yearly update cycle of the life tables, we apply different interpolation methods to perform the IASU decomposition and analyze the effects of these methods on the surplus decomposition. Our results show that Lee-Carter and linear interpolation yield almost identical decompositions, whereas constant approximations results in substantially different decompositions. As a consequence, reporting standards and regulators should clarify how to interpolate mortality risks.
This study aims to determine whether the application of Deep Reinforcement Learning (DRL) as a specialized execution overlay can enhance pair trading in highly volatile cryptocurrency markets. Although classical implementations of the strategy have proven successful in traditional equities, they frequently exhibit rigidity and suffer from severe divergence risks when applied to high-variance environments. To address this need, this research introduces novel concepts. To construct a robust system, we developed a hierarchical "Filter-then-Rank" pair selection methodology and a proprietary "Fixed Risk, Adaptive Mean" execution model. The system employs a Proximal Policy Optimization (PPO) agent with a Long Short-Term Memory (LSTM) layer to govern execution decisions within strict deterministic risk management boundaries. Evaluated on 1-hour interval data from the Binance USD-M Futures market, the optimized RL policy achieved an out-of-sample performance that substantially outperformed the heuristic baseline. A stationary circular block bootstrap robustness check confirms that the agent's risk-adjusted outperformance is statistically significant at the 10 percent level. Although falling marginally short of the stricter 5 percent threshold, this result highlights the extreme idiosyncratic variance characteristic of digital assets. Ultimately, this thesis contributes to the quantitative finance literature by introducing a hybrid architecture that combines statistical arbitrage with DRL execution policies. Furthermore, it delivers a novel framework for safe reinforcement learning via deterministic shielding, proving that anchoring a neural policy to statistically robust boundaries successfully mitigates severe divergence risks.
We introduce the Polymarket-v1 Database: the complete on-chain trade archive of Polymarket's first-generation CTF Exchange on Polygon, spanning 2022-11-21 to 2026-04-28 and covering the full contract lifecycle from first settlement to natural termination. The dataset comprises 1.20 billion trade records across 1.30 million markets with $61 billion in nominal volume. Its defining feature is 100% ground-truth aggressor direction derived from the blockchain settlement layer, a property unavailable in existing prediction market archives, which rely on heuristic inference. We use this truth-aligned archive to benchmark standard microstructure tools and document three findings. First, the tick rule and bulk volume classification achieve near-random aggregate accuracy (49.83% and 50.51%), but this masks a systematic, correctable price-level gradient driven by positive trade direction autocorrelation and concentrated market-making -- two structural features of prediction markets that violate the mean-reversion assumption embedded in classical classifiers. Second, these classification errors propagate into downstream metrics: inferred VPIN diverges substantially from ground-truth VPIN, and OFI estimates are directionally biased, with material consequences for Transaction Cost Analysis. Third, ground-truth microstructure quality predicts forecasting performance in ways that classification-based proxies cannot recover: True VPIN positively predicts Brier scores, while Gibbs spread negatively predicts them -- a selection effect reflecting that high-spread niche markets attract informed specialists rather than noise traders. Replacing ground-truth metrics with classified proxies attenuates both relationships, illustrating that measurement accuracy at the transaction level is a prerequisite for reliable inference about prediction market design and probability calibration.
Changes in volatility contain valuable information about the likelihood of positive versus negative returns. We propose a new approach to modeling financial returns that exploits this insight by decomposing returns into sign and magnitude (absolute value) components, with magnitude closely related to volatility. The joint distribution used to compute expected returns combines a model for the marginal distribution of magnitude with a model for the distribution of the sign, conditional on the contemporaneous magnitude. Unlike traditional linear predictive regressions, this decomposition framework captures nonlinear predictability in return dynamics. An out-of-sample forecasting evaluation using monthly U.S. stock market excess returns demonstrates substantial statistical and economic gains relative to linear regression and complete subset regression, while delivering performance that is competitive with copula-based return-decomposition methods and other nonlinear benchmarks.
We present a hybrid news sentiment engine that continuously learns market
sentiment from paired news headlines and concurrent asset-price snapshots
without requiring any neural network training or GPU compute. The system uses
a three-way ensemble combining (1) a financial-domain lexicon (FinBERT-style
keyword scoring), (2) an adaptive statistical TF-IDF cluster learner that
organizes headlines into semantic neighborhoods and tracks their average
realized price reactions, and (3) an auto-calibrating weighting mechanism
that adjusts ensemble contributions based on each signal's historical
correlation with actual price movements. The engine runs on a 3-hour polling
cycle from the Tradeflags NewsFeed API, which provides 22 price-snapshot
fields per news item spanning equity indices (ES, NQ, SPY, DJIA, NDX, IWM),
commodities (CL), and cryptocurrencies (BTC, ETH). All processing occurs at
sub-second latency on a CPU-only server at effectively zero marginal cost per
analytic cycle. We compare our approach against established methods --
FinBERT, GPT-based scoring, VADER, and commercial sentiment APIs -- across
dimensions of cost, latency, accuracy, and adaptability. Our statistical
cluster learner, which adapts to changing market regimes without retraining,
represents a novel contribution not found in existing sentiment systems.
Financial forecasting is difficult due to low signal-to-noise ratios, latent factors, heavy tails, regime shifts, and jumps. Real-world benchmarks offer limited failure attribution: researchers can observe underperformance, but often cannot isolate why because mechanisms are unobservable and entangled. Real financial data reveal only one realized path, making it difficult to assess tail-risk calibration or data efficiency. We introduce FinStressTS, a mechanism-aware synthetic benchmark that links model behavior to controlled structural causes. FinStressTS comprises 30 diagnostic environments around six mechanism families: volatility clustering, multi-scale persistence, heavy-tailed shocks, regime switching, self-exciting jumps, and zero-inflated processes. We evaluate two tasks: point forecasting, using NMAE across five settings, and probabilistic forecasting, using CRPS under known data-generating mechanisms. We benchmark 15 models, from classical methods (HAR, VAR) to Transformer forecasters (PatchTST, iTransformer) and deep probabilistic architectures (DeepAR, TSFlow), and use learning curves to measure sample efficiency. Our evaluation reveals three insights. First, performance is mechanism-dependent: autoregressive and linear models are highly competitive, and often outperform Transformer-based models, in several volatility-, tail-, and jump-driven environments. Second, distributional alignment matters: parametric probabilistic models such as DeepAR calibrate well in stationary settings, while flexible models can help when distributions become multimodal or sparse. Third, neural models often require more data to match simple baselines, with larger gains mainly when learning latent regimes or complex distributions. FinStressTS provides an open framework for diagnosing failure modes and advancing risk-aware forecasting.
The standard generalization bounds assume that the training and deployment distributions are the same, or are static, and don't consider regime switching environments where the ratio of calm vs crisis states is different. This paper proposes a framework that generalizes regime-aware models by quantifying the extra risk due to regime composition mismatch, when distribution shifts are Markov-switching. We obtain an exact decomposition, separating regime mismatch from regime sensitivity; we extend the bound to beta-mixing data using the effective sample size corrected for the spectral gap; and we show a minimax lower bound for synthetic data and on 25 years of global equity indices. The proposed penalty is an ex post realized generalization gap, whereas the training-only estimator does not show significant correlation: the feature geometry of crises can be detected, but not the temporal arrival. Thus, the framework is not a forecast machine. Forecasting the composition of the future regime is an open question in the rare cases of regime change.
The relation follows directly when volatility obeys an inverse gamma distribution generated by the process for short intervals.
abstractclick to expand
Q-variance (so-called) posits a statistical relationship $\mathbf{E}(\sigma^2 | z) = \sigma_0^2 + \tfrac{1}{2}z^2$ between an asset's volatility $\sigma^2$, as observed in a time interval $T$, and its (suitably scaled) return $z$ in the same interval. We here show that this relationship is {\em exactly equivalent} to to positing an Inverse Gamma probability distribution for $\sigma^2$ itself. We then show that such a distribution is exactly generated by a multiplicative Langevin process with an arbitrary, settable coherence time $\tau_c$, so that very nearly the same Q-variance relationship will hold for all $T \ll \tau_c$.
Deep learning models show promise in financial forecasting, yet their generalization is often undermined by small datasets, noisy signals, and non-stationarity. While meta-learning and related techniques mitigate some of these issues, they typically do not account for a core limitation in macro-financial prediction: the scarcity of distinct macroeconomic regimes that drive asset returns. We introduce HANET (Hierarchical Attention Network), a hybrid LSTM-based architecture that integrates macroeconomic domain knowledge through attention over long-run macro contexts while preserving high-frequency market dynamics. HANET organizes information in a hierarchical mixed-frequency structure, with daily asset-return signals nested within monthly macroeconomic windows, and introduces a Hierarchical Cross-Attention mechanism that reconciles low-frequency macro signals with high-frequency returns without discarding granular daily information. By framing regime selection as attention over macroeconomic contexts, the model adapts to scarce and shifting regimes. Empirically, across 55 liquid futures spanning multiple asset classes, HANET consistently outperforms neural forecasters that ignore macroeconomic information, particularly during turbulent periods, improving risk-adjusted returns and mitigating losses. Ablation studies show that these gains rely on structured macro conditioning rather than naive feature augmentation: an LSTM with the same macro representation performs poorly, and shuffling macro contexts substantially degrades performance. Finally, HANET provides interpretability through attention weights, highlighting which historical regimes are most influential for each forecast and linking macro conditions to portfolio outcomes. These results establish HANET as a systematic approach to integrating macroeconomic information into attention-based deep learning for financial forecasting.
We show that persistent dynamics of a latent default-probability path can generate effective default correlation through temporal coarse-graining. In the OU--Binomial baseline, monthly defaults are conditionally independent given this latent path, but aggregating monthly default probabilities into long-horizon probabilities induces a scale-dependent effective mixing distribution for aggregated default counts. Applied to corporate default-count data, this mechanism explains long-horizon overdispersion, autocorrelation, and the emergence of effective default correlation. We then examine Davis--Lo-type contagion and Vasicek-type common-factor extensions. Direct fitting at each aggregation scale assigns increasing residual covariance shares to instantaneous dependence, but worsens the per-block expected log predictive density. In contrast, when monthly posterior latent paths are first coarse-grained and residual-dependence parameters are estimated conditional on these paths, the residual covariance contributions remain small while the predictive density improves. Thus, temporal coarse-graining provides a scale-consistent baseline that regularizes the attribution of variance and improves identifiability by suppressing the over-allocation of long-horizon fluctuations to contagion or asset-correlation parameters.
We study offline change-point estimation for time series data exhibiting nonlinear serial dependence. To address this problem, we propose a copula-based Markov chain model with Weibull marginal distributions, which is suitable for modeling nonnegative data such as event times and volatility measures. Nonlinear dependence is incorporated through the Clayton and Joe copulas, allowing the model to capture asymmetric lower-tail and upper-tail dependence structures, respectively. We derive the corresponding likelihood function and estimate the change point and model parameters using maximum likelihood estimation implemented through the Newton--Raphson algorithm. Confidence intervals are constructed via a parametric bootstrap Monte Carlo procedure. Extensive numerical studies are conducted to evaluate the finite-sample performance and robustness of the proposed method under different dependence structures and copula misspecification scenarios. The results demonstrate that the proposed estimators perform well in terms of RMSE and relative error, particularly for the estimation of the change point. An empirical application to the VIX index during the COVID-19 pandemic further illustrates the practical usefulness of the proposed approach in detecting structural changes in both the marginal distributions and serial dependence structure.
This paper compares a series of contemporary portfolio construction approaches by employing ten U.S. stocks (TSLA, WMT, BAC, GS, LLY, MRK, GOOG, META, AAPL and XOM) in a time frame from September 2023 to December 2025. The paper explores both basic mean-variance optimization, constrained optimization, Fama French five factor regression modeling, Monte Carlo simulation, and the Black-Litterman model to determine how constraints to a solution, risk factors to a strategy, simulated approximations, and specific market views may all impact the outcome of portfolio allocation, performance and stability. Overall, the results show that standard optimization may result in highly concentrated portfolios, while constrained optimization leads to changes in portfolio allocations by altering the efficient frontier, five factor regression models suggest that a basic investment style of defensive large value and profitability exposure, Monte Carlo approximation is a viable technique to arrive at mean-variance optimal portfolios provided the simulations are high enough especially under a box constraint, the Black Litterman portfolio approach produces more economically intuitive allocations and greater stability compared to standard mean-variance optimization as the approach balances equilibrium returns with investor views.
This study looks at the statistical properties and predictability using deep learning methods of the U.S. aggregate bond index in daily observations spanning 2018 to February 2026. We first establish that index levels are extremely persistent and consistent with unitroot behavior (Dickey and Fuller), while log returns are covariance-stationary with weak linear dependence and pronounced volatility clustering characteristic of ARCH-type processes (Engle; Bollerslev). Motivated by the trade-off between stationarity and information retention, we construct a "stationary but maximally persistent" representation via fractional differencing (Granger and Joyeux; Hosking) following the procedure of L\'opez de Prado, and evaluate shorthorizon forecast using two neural paradigms: (i) Multilayer Perceptrons (MLPs) trained on lagged vectors with joint lag-length and hyperparameter tuning (Hornik et al.; Rumelhart et al.); and (ii) Convolutional Neural Networks (CNNs) trained on Gramian Angular Field (GAF) image encodings (Wang and Oates). Empirically, MLPs match the strong naive persistence benchmark on levels, collapse toward near-zero forecasts on returns, and achieve the strongest incremental performance on the fractionally differenced series, where moderate dependence remains but unit-root drift is attenuated. In contrast, CNN-GAF models deliver consistently negative out-of-sample R 2 across all three representations. Overall, the results imply that, for short-horizon forecasting of broad bond indices, the primary determinant of predictive performance is the transformation of the series-its degree of stationarity and memory-rather than architectural complexity. Lag-based models remain competitive under persistence, while GAFbased CNNs are better suited to pattern-based tasks than to persistence-dominated next-step prediction.
Heston-Bates-CIR calibration to equity options and Euribor shows continuous volatility controls short horizons while stochastic rates affect
abstractclick to expand
This study develops an integrated stochastic modeling framework for pricing short and medium-maturity equity options and assessing interest-rate risk using the Heston (1993), Bates (1996), and CIR (1985) models. We calibrate the Heston model using both the Lewis (2001) Fourier inversion and the Carr-Madan (1999) FFT approach, finding near-identical parameter sets, which is consistent with the calibration stability reported in recent studies such as Agazzotti et al. (2025). Extending the model to Bates shows that jump intensities converge to values effectively equal to zero for 60-day maturities, echoing empirical findings that jumps contribute marginally to short-term smile fitting. We further compare our calibration approach with the joint volatility-surface and variance-term-structure framework proposed by Yoo (2025), confirming that standard Heston/Bates calibration remains robust for the maturities considered. Finally, we calibrate the CIR short-rate model to the Euribor term structure, generating positive and economically consistent forward-rate scenarios in line with recent stochastic-rate option-pricing research by Jeon and Kim (2025). Overall, our results show that continuous stochastic volatility dominates near-term pricing dynamics, while stochastic interest rates materially influence valuations beyond one year.
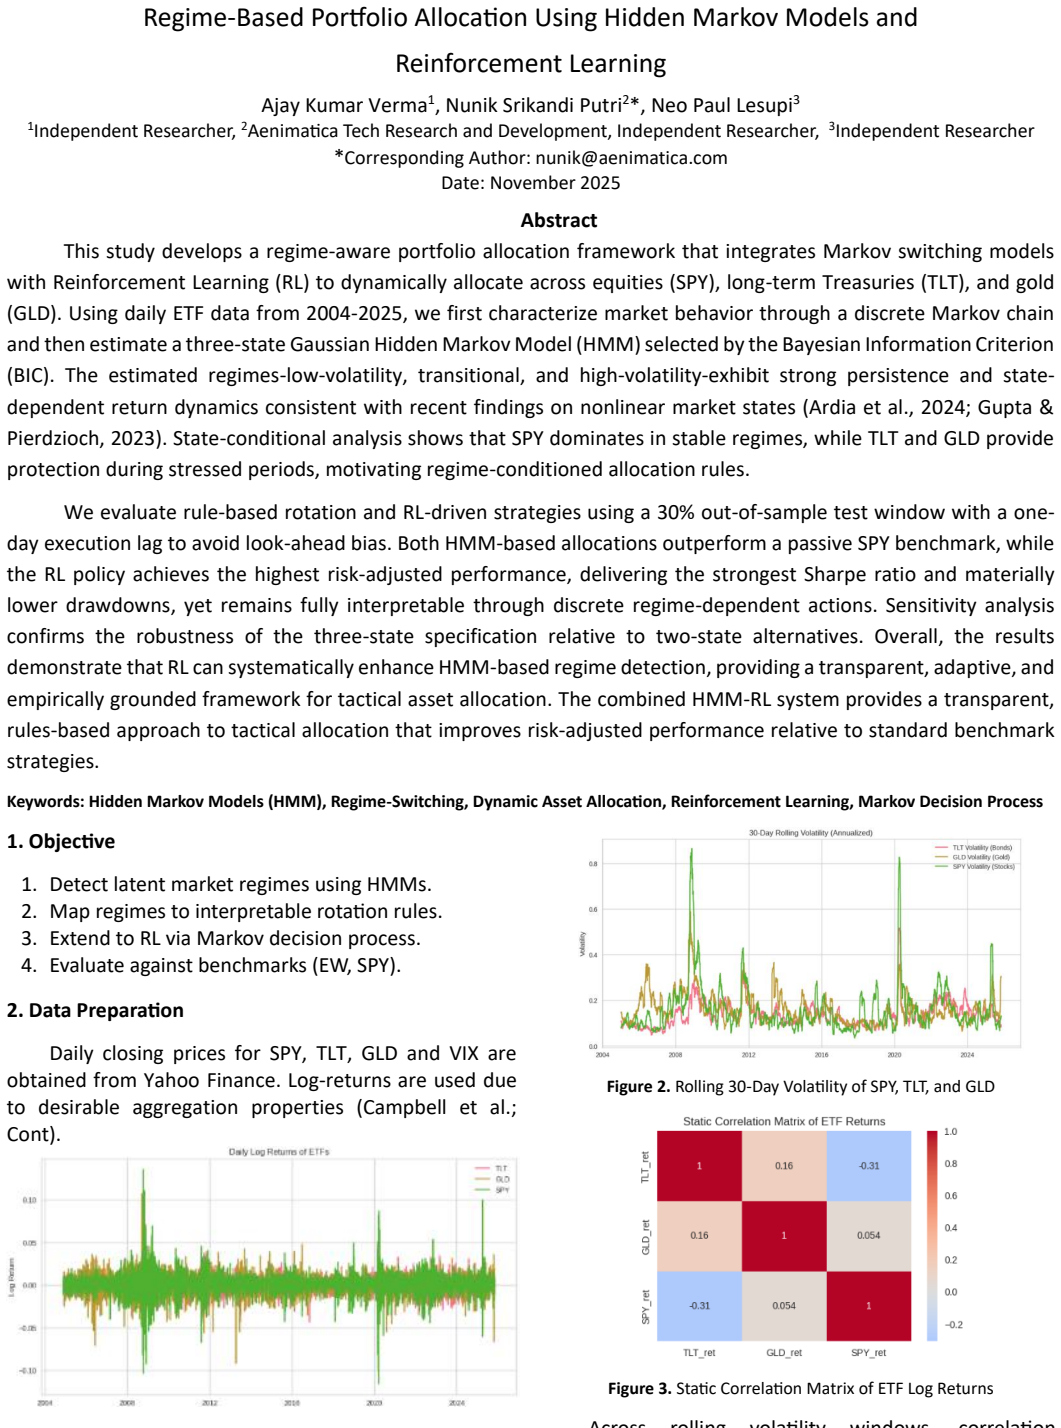
This study develops a regime-aware portfolio allocation framework that integrates Markov switching models with Reinforcement Learning (RL) to dynamically allocate across equities (SPY), long-term Treasuries (TLT), and gold (GLD). Using daily ETF data from 2004-2025, we first characterize market behavior through a discrete Markov chain and then estimate a three-state Gaussian Hidden Markov Model (HMM) selected by the Bayesian Information Criterion (BIC). The estimated regimes-low-volatility, transitional, and high-volatility-exhibit strong persistence and state-dependent return dynamics consistent with recent findings on nonlinear market states (Ardia et al., 2024; Gupta & Pierdzioch, 2023). State-conditional analysis shows that SPY dominates in stable regimes, while TLT and GLD provide protection during stressed periods, motivating regime-conditioned allocation rules.
We evaluate rule-based rotation and RL-driven strategies using a 30% out-of-sample test window with a one-day execution lag to avoid look-ahead bias. Both HMM-based allocations outperform a passive SPY benchmark, while the RL policy achieves the highest risk-adjusted performance, delivering the strongest Sharpe ratio and materially lower drawdowns, yet remains fully interpretable through discrete regime-dependent actions. Sensitivity analysis confirms the robustness of the three-state specification relative to two-state alternatives. Overall, the results demonstrate that RL can systematically enhance HMM-based regime detection, providing a transparent, adaptive, and empirically grounded framework for tactical asset allocation. The combined HMM-RL system provides a transparent, rules-based approach to tactical allocation that improves risk-adjusted performance relative to standard benchmark strategies.
Predicting stock price movements during Earnings Announcements (EAs) is a significant challenge due to market noise and high-impact price discontinuities. In this study, we evaluate whether pre-announcement news sentiment, firm fundamentals, and recent market dynamics jointly predict the directional price movement of equities on EA days. We construct a multi-modal feature space combining 15 fundamental metrics, 3 price-based technical indicators and sentiment scores derived from financial news articles processed using FinBERT. We compare a Long Short-Term Memory (LSTM) network and a Transformer-based architecture against a logistic regression baseline, and further assess all models with and without sentiment features to quantify their incremental value. Our results indicate that while the LSTM demonstrates higher precision through a conservative safe-bet strategy, the Transformer model exhibits superior sensitivity in identifying volatile movements, achieving a higher macro F1-score, with ablation experiments showing a consistent benefit from incorporating news sentiment.
This paper studies the joint role of long-memory dynamics,rough-volatility behavior, and persistence-based forecasting features in equity volatility modeling. We combine semiparametric long-memory estimation, rough-volatility diagnostics, and structured forecasting regressions to examine whether persistence measures contain economically meaningful forecasting information beyond conventional volatility predictors. Using a panel of 115 S&P500 constituents from November 2001 through April 2026, we document that volatility proxies exhibit substantial long-memory behavior and locally rough dynamics. The cross-sectional mean Geweke-Porter-Hudak estimate of the memory parameter is $\hat{d} = 0.226$, while the corresponding local-Whittle estimate is $\hat{d} = 0.440$, with statistical significance observed across nearly the entire panel. Rolling estimates of persistence rise substantially during the global financial crisis and the COVID period and display a positive contemporaneous association with the VIX. We then examine whether persistence-related features improve out-of-sample volatility forecasts beyond standard HAR and HAR-X benchmarks. Incorporating cross-sectional persistence aggregates, sectoral persistence measures, and persistence-by-stress interaction terms produces moderate but statistically significant forecasting improvements, particularly at longer horizons and during stress regimes. Forecast gains are strongest during periods of elevated market volatility and in volatility-managed portfolio applications. The results suggest that persistence measures may serve as useful reduced-form indicators of the duration and propagation of uncertainty in financial markets, although the paper does not claim structural identification of the economic mechanisms generating persistence.
This paper examines how wartime economic controls shaped stock-price formation in Japan from 1930 to 1943. We develop a four-portfolio asset-pricing model in which zaibatsu affiliation affects expected payoffs and the translation of valuations into economic scale through lower financing wedges. We then construct daily capitalization-weighted indices and four benchmark portfolios based on a two-by-two sort by zaibatsu affiliation and military orientation. Using a CAPM-AR(p)-SV event-study framework that allows for serial correlation and stochastic volatility, we show that the model rationalizes capitalization concentration, segmented abnormal returns, delayed cumulative adjustment, regime-risk insulation of zaibatsu portfolios, and zaibatsu-concentrated responses to embedded-rent or group-continuation shocks. The evidence is consistent not with a collapse of semi-strong efficiency, but with institutionally contingent efficiency: stock prices continued to respond to news while capitalizing uneven access to credit, materials, and procurement.
Awareness of self-reinforcing dynamics raises directional accuracy unevenly for three frontier models on dot-com and GFC data.
abstractclick to expand
We study how frontier large language models (LLMs) behave as financial forecasters during boom-bust market cycles when made progressively aware of Soros's theory of reflexivity. Standard AI-assisted forecasting treats the market as an exogenous system. Reflexivity theory holds otherwise: prices shape fundamentals, and every forecaster is a participative agent in the loop it analyzes. We evaluate three frontier models - GPT5, Claude Sonnet 4.6, and Gemini 3 Pro - under four accumulating zero-shot conditions across two historically distinct episodes: the dot-com bubble (1996-2001) and the global financial crisis (2004-2009). The primary metric is directional forecasting accuracy; we also report the Sharpe ratio of an implied long/cash strategy to capture the risk-adjusted economic value of the forecasts. All inputs are anonymized and normalized to guard against memorization. We find that conditions incorporating reflexivity awareness improve forecasting accuracy differently across models and context windows, revealing that the same theoretical awareness can produce qualitatively different forecasting behavior across frontier LLMs.
Risk management is an important part of financial practice, essential for protecting assets and investments in modern-day volatile markets. This paper proposes a mixture of mirrored Weibull (MMW) distribution for modelling stock returns and estimating risk measures. Unlike common practices which are typically based on the normal distribution, the MMW model can flexibly accommodate non-normal features frequently exhibited in financial data. It also enjoys appealing properties such as having a simple density expression and fast parameter estimation. We demonstrate the effectiveness of our model by assessing its performance in Value-at-Risk (VaR) estimation of three S&P500 stocks. The MMW model compares favourably to Gaussian mixture model and t-mixture model, with significant improvements in VaR estimation and prediction.
Walk-forward tests on MNQ five-minute data show accuracies stuck at the 51.8 percent base rate.
abstractclick to expand
This paper compares gradient boosting and long short-term memory (LSTM) architectures for intraday directional prediction in Micro E-Mini Nasdaq 100 futures (MNQ). Motivated by recent foundation-model research on financial candlestick data, including the Kronos architecture, we test whether five-minute OHLCV bar sequences contain exploitable sequential predictive structure at the scale of a single instrument dataset. Using 944 trading days from 2021-2025, four model configurations are evaluated under strict expanding-window walk-forward validation across three out-of-sample periods. The target variable is whether the session close exceeds the 10:30 AM open by more than ten points. No configuration produces statistically significant out-of-sample accuracy above the 51.8% base rate. Combined OOS accuracies range from 50.00% to 50.89% across gradient boosting variants, while the LSTM achieves 50.59%. Permutation tests yield p-values of 0.135 for the best gradient boosting model and 0.515 for the LSTM, indicating no statistically significant predictive edge. Feature importance instability across walk-forward folds suggests noise fitting rather than stable structural signal capture. The results indicate that four years of single-instrument five-minute OHLCV data are insufficient for reliable sequential ML-based intraday forecasting. The primary contribution is a documented evaluation of a Kronos-inspired architecture on a constrained real-world dataset, providing an empirical lower bound on data scale requirements for sequential financial ML.
Regime shifts in financial markets reorganise the joint dynamics of asset prices and macro variables, breaking any single-regime calibration. They are nonetheless difficult to detect reliably because the data signal is noisy and heavily multicollinear, while the contemporaneous text that announces them is unstructured. Standard regime shift detection methods rely solely on structured time-series data and ignore policy communications, even though these texts often signal shifts before they materialise in observed prices. We propose a text-enhanced regime shift detection pipeline that combines large language model (LLM) reasoning over central-bank communications with statistical validation on multivariate financial time series. The framework is detector-agnostic: text-proposed candidates are validated using a bootstrap likelihood-ratio test on a vector autoregression (VAR), while data-driven candidates from arbitrary regime detectors are ratified through a lenient LLM text check. We evaluate the framework on 2010-2024 FOMC minutes paired with a 14-variable U.S. Treasury and macroeconomic panel, using four interchangeable data-driven detectors. The proposed pipeline achieves F1 = 0.82 against a verified anchor list of monetary-policy regime shifts, with same-day modal detection latency and consistently stronger performance than pure data-driven baselines. The results demonstrate that combining unstructured policy text with statistical structural-break detection improves the robustness and interpretability of regime shift identification in financial markets.
We extract four geometric observables -- Berry Phase Rate, Spectral Entropy, Reduced State Purity, and Hamiltonian Sensitivity -- from a learned spectral embedding of equity-index returns and evaluate them as regime-shift detectors against 46 classical and machine-learning baselines on 17 historical crises spanning 2000-2024. Under walk-forward nested hyperparameter selection on nine labelled windows, the Berry Phase Rate achieves an unbiased out-of-sample median Cohen's $d = 0.72$ (95% percentile-bootstrap CI $[0.34, 1.18]$, 10,000 resamples) and produces approximately 67% fewer false alarms per year than a label-supervised Random Forest (1.2 vs. 3.6 per year). Reduced State Purity attains the highest in-sample separability of any method ($d = 0.83$), tied closely by the Absorption Ratio ($d = 0.80$); geometric and classical channels are largely uncorrelated (mean $|\rho| \approx 0.22$), suggesting they capture distinct risk signals. Score construction is unsupervised; hyperparameter selection is the only supervised step.
In this article we model chaotic dynamics in financial markets by treating the market price, and market makers' inventory, as anharmonic oscillators with a nonlinear coupling. The market makers' risk appetite being the key parameter that determines the degree of chaos in the system. The article demonstrates that whilst external shocks and random noise are important in the treatment of financial time-series, they are not necessary in order to generate unpredictable price changes.
This paper studies Markov-switching (MS) models with time-varying transition probabilities (TVTP) under various specifications of the transition probability matrix. Especially, we extend the two-regime common-variance setting of the Generalized Autoregressive Score (GAS) model from (Bazzi et al., 2017) to the general $K$-regime case with regime-specific means and variances. Our study contains comprehensive Monte Carlo simulations and we developed an open-source R package, \texttt{multiregimeTVTP}, for data simulation and parameter estimation. We find that the regime means, variances, and transition probabilities are reliably recovered, whereas the TVTP driving coefficients are harder to identify. Another finding from our paper is that the GAS score coefficient appears to be statistically non-identifiable, due to a ridge in the joint likelihood surface $(\sigma^2,A)$. In addition, we find that one-step point forecasts are remarkably robust to TVTP misspecification, but filtered regime probabilities are not, so correct specification matters most for characterizing regime dynamics rather than short-horizon forecasting. An empirical application to U.S. Treasury zero-coupon yield changes at four maturities (1961-2024) shows that an exogenous specification driven by the lagged yield level dominates the constant and lagged-change models in fit, while the GAS specification fails to converge, with $\hat{A}$ collapsing to zero, reflecting the same identifiability issue observed in simulation.
In algorithmic markets, predictive models become part of the data-generating process they aim to forecast. Once their outputs are converted into trades, allocations, execution schedules, or risk controls, they change the future data on which they are evaluated. I introduce algometrics, a framework for time series whose evolution depends on the predictive algorithms forecasting them. The framework distinguishes historical risk, measured under passive forecasting, from deployment risk, measured when forecasts drive actions. I prove three results. First, deployment risk is not identifiable from passive historical data alone: even in a one-step linear feedback model, infinitely many algorithm-mediated environments induce the same historical law while implying different deployment risks for the same forecaster. Second, historical model rankings can invert under crowding, so a predictor with lower passive error can have higher deployment error once similar algorithms are adopted. Third, randomized or instrumented actions identify short-horizon linear feedback, and I derive a finite-sample bound for deployment-risk estimation. These results suggest that time-series benchmarks in algorithmic markets should report feedback sensitivity alongside predictive accuracy.
Predicting cross-sectional stock returns is challenging due to low signal-to-noise ratios and evolving market regimes. Classical factor models offer interpretability but limited flexibility, while deep learning models achieve strong performance yet often underutilize financial priors. We address this gap with PRISM-VQ (PRior-Informed Stock Model with Vector Quantization), a dynamic factor framework that integrates expert prior factors, vector-quantized discrete latent factors learned from cross-sectional structure, and a structure-conditioned Mixture-of-Experts to generate time-varying factor loadings. Vector quantization acts as an information bottleneck that suppresses noise while capturing robust market structure, with discrete codes serving both as latent factors and as routing signals for temporal expert specialization. Experiments on CSI 300 and S&P 500 show consistent improvements in cross-sectional return prediction and portfolio performance over strong baselines while preserving interpretability. Our code is available at https://github.com/finxlab/PRISM-VQ.
Estimating the covariance of asset returns, i.e., the risk model, is a key component of financial portfolio construction and evaluation. Most risk modeling approaches produce a factor model that decomposes the asset variability into two components: the first attributed to a small number of factors that are common among the assets and the second attributed to the idiosyncratic behavior of each asset. Third-party providers typically provide risk models to investors, and while these models are typically of high quality, they may fail to capture important information, e.g., changing market regimes and transient factors. To overcome these limitations, we propose a systematic method based on maximum likelihood estimation to enhance an existing factor model by both refining the given model and adding new statistical factors. Our approach relies only on the observed sequence of realized returns and on the choice of two hyperparameters: the number of additional factors and the half-life parameter that determines the weights assigned to returns in the log-likelihood objective. Importantly, our methodology applies to the situation where asset returns may be missing, making it suitable for typical equity datasets. We demonstrate our approach on the Barra short-term US risk model, a high-quality risk model used in practice, for a universe of US high-capitalization equities. We show that the proposed extension captures structure in the returns that is missed by the original model.
RED-2400 is a public benchmark of 6,660 algorithmically-rejected trading events from a live Solana decentralised-exchange filter stack, observed continuously over 22 calendar days (2026-04-10T21:10Z through 2026-05-02T21:48Z, UTC). Each rejection event is linked to its post-rejection price-and-liquidity trajectory. The deposit contains 169,123 forward-outcome observations and 1,837 graveyard-tracker lifecycle snapshots, covering 1,076 distinct mints in the rejection registry and 1,075 in the forward-observation file. Outcome labels follow the five-tier classification rule introduced by a related methodology paper [Kamat 2026c]. The deposit includes a lifecycle-tracker file that permits external validation of any subset of those labels against observed token-lifecycle ground truth. Filter labels are anonymised to filter_1 through filter_8; source-collector identifiers to source_a and source_b. Liquidity and 24-hour volume are quantised to the nearest power of two, preserving heavy-tailed shape while preventing operational-threshold inference. This is the first window of a planned series; subsequent windows will extend the time horizon and enable regime-stratified analysis. "RED-2400" is a brand name, not a count; current cohort sizes are listed below and do not equal 2,400.
This research aims to leverage machine learning to improve stock price prediction and support informed investment decisions related to buying, selling, and holding assets. Specifically, this work investigates transformer-based models for stock prediction and examines the impact of pre-training strategies on forecasting performance. A transformer model was first pre-trained on the Toronto Stock Exchange Index (TSX) to predict intra-day return direction and subsequently fine-tuned on individual TSX stocks. The model was further adapted for return-value regression tasks. Performance was benchmarked against Long Short-Term Memory (LSTM) and XGBoost models. Pre-training on the market index improved the binary cross-entropy loss for individual stock prediction from 0.69 to 0.64. The fine-tuned transformer regression model achieved lower mean squared error than the benchmark models, although the ensemble and XGBoost models achieved higher average daily returns. In addition, a practical application was developed to deliver real-time stock predictions for trading support. Future work will focus on increasing transformer model capacity, incorporating broader global technical indicators, and filtering out stocks with low predictability.
We present a new class of Bayesian dynamic models for bivariate price-realized volatility time series in financial forecasting. A novel dynamic gamma process model adopted for realized volatility is integrated with traditional Bayesian dynamic linear models (DLMs) for asset price series. This represents reduced-form volatility leverage and feedback effects through use of realized volatility proxies in conditional DLMs for prices or returns, coupled with the synthesis of higher frequency data to track and anticipate volatility fluctuations. Analysis is computationally straightforward, extending conjugate-form Bayesian analyses for sequential filtering and model monitoring with simple and direct simulation for forecasting. A main applied setting is equity return forecasting with daily prices and realized volatility from high-frequency, intraday data. Detailed empirical studies of multiple S&P sector ETFs highlight the improvements achievable in asset price forecasting relative to standard models and deliver contextual insights on the nature and practical relevance of volatility leverage and feedback effects. The analytic structure and negligible extra computational cost will enable scaling to higher dimensions for multivariate price series forecasting for decouple/recouple portfolio construction and risk management applications.
Herding -- where agents align their behaviors and act collectively -- is a central driver of market fragility and systemic risk. Existing approaches to quantify herding rely on price-correlation statistics, which inherently lag because they only detect coordination after it has already moved realised returns. We propose GeomHerd, a forward-looking geometric framework that bypasses this observability lag by quantifying coordination directly on upstream agent-interaction graphs. To generate these graphs, we treat a heterogeneous LLM-driven multi-agent simulator -- each financial trader instantiated by a persona-conditioned LLM call -- as a forecastable world, and evaluate the geometric pipeline on the Cividino--Sornette continuous-spin agent-based substrate as our headline financial testbed. By tracking the discrete Ollivier--Ricci curvature of these action graphs, GeomHerd captures the structural topology of emerging coordination. Theoretically, we establish a mean-field bridge mapping our graph-theoretic metric to CSAD, the classical macroscopic herding statistic, linking GeomHerd to downstream price-dispersion measurement. Empirically, GeomHerd anticipates herding long before aggregate market baselines: on the continuous-spin substrate, our primary detector fires a median of 272 steps before order-parameter onset; a contagion detector ($\beta_{-}$) recalls 65% of critical trajectories 318 steps early; and on co-firing trajectories the agent-graph signal precedes price-correlation-graph baselines by 40 steps. As a complementary indicator, the effective vocabulary of agent actions contracts during cascades. The geometric signature transfers out-of-domain to the Vicsek self-driven-particle model, and a curvature-conditioned forecasting head reduces cascade-window log-return MAE over detector-conditioned and price-only baselines.
Pre-market conditions mark mornings with drift and afternoons with reversal, yet every tested rule fails after transaction costs and year-by
abstractclick to expand
This paper constructs and validates a composite day-classification system for Micro E-Mini Nasdaq 100 futures (MNQ) using three pre-market observable conditions: first-30-minute return magnitude, overnight gap magnitude, and abnormal opening-bar volume relative to a rolling baseline. Using 947 regular trading days of five-minute data from 2021-2025, we find that classifier-positive days exhibit statistically distinct intraday behavior, including directional morning drift followed by systematic late-session reversal. Despite these descriptive characteristics, all tested directional trading strategies fail institutional validation standards after transaction costs and multi-year consistency requirements are applied. The highest-performing configuration achieves T = 1.46 and mean net +7.80 points but fails year-stability criteria. The primary contribution is the validation of the Volatility-Volume-Gap (VVG) classifier as a descriptive regime-identification framework and the documentation of failed attempts to convert these statistical patterns into deployable trading signals under realistic execution constraints.
Agent-based models (ABMs) are increasingly used in macroeconomics, but their analysis still often relies on ad hoc Monte Carlo campaigns with heterogeneous statistical effort across parameter settings. We show how statistical model checking (SMC), implemented through MultiVeStA, can provide a principled analysis layer for a realistic macroeconomic ABM without rewriting the simulator in a dedicated formalism. Our case study is the heuristic-switching Keynes+Schumpeter(K+S) model, analysed hrough a transient sensitivity campaign over one-parameter sweeps, two macro observables (unemployment and GDP growth), and one auxiliary micro-level probe (market share) on the post-warmup phase of a 600-step horizon. The analysis is driven by reusable temporal queries, observable-specific precision targets, and confidence-based stopping rules that automatically determine the simulation effort required by each configuration. Results show a clear contrast across parameter families: macro-financial and structural sweeps produce the strongest transient effects, whereas several heuristic-rule sweeps remain much weaker under the same precision policy. More broadly, the paper shows that SMC can support reproducible and informative quantitative analysis of substantively rich economic ABMs, while making uncertainty estimates and simulation cost explicit parts of the reported results.
Public procurement is vulnerable to error, fraud, and corruption, particularly as high transaction volumes overwhelm oversight. While research often focuses on tender-stage anomalies, post-award payment monitoring remains underexplored. Since labelled datasets are rare and methods like Benford's Law face restrictive assumptions, there is a need for interpretable, unsupervised frameworks for high-volume procurement oversight and decision support. This paper introduces the Structural Heterogeneity Index (SHI), a composite statistic for one-dimensional samples, and its payment-specific instantiation, the Payment Heterogeneity Index (PHI), characterising payment structure and latent regimes. It incorporates Gaussian Mixture Model (GMM) parameters alongside non-parametric statistics, integrating four interpretable components: modality, asymmetry, tail behaviour, and structural dispersion. Uniquely, the tail-behaviour component captures both distributional heaviness and extreme-value concentration, while structural-dispersion combines the variability, prevalence, and separation of latent payment regimes. Applied to UK municipal procurement data, PHI identifies a financially significant cohort (0.6\% of suppliers; 10.1\% of high-volume vendors) with structurally distinct payment patterns. Statistical testing further supports these differences, and targeted human verification confirms the plausibility of prioritised cases. Comparative analysis shows PHI reveals regime separation obscured by the Coefficient of Variation ($\rho = 0.310$). PHI provides a transparent, decomposable, and computationally lightweight framework for procurement integrity oversight and targeted audit prioritisation.
Using Chronos-2, an open-source time-series foundation model, we evaluate pretrained time-series models for economic and financial forecasting with an emphasis on whether multivariate (MV) inputs improve accuracy relative to univariate (UV) baselines. The study covers two panels -- the Magnificent-7 equities and U.S. Treasury interest rates -- as well as a combined panel, using rolling monthly evaluations from 2000--2025. We vary input window lengths and forecast horizons and report RMSE and MAPE. Across datasets, MV forecasts consistently outperform UV forecasts, with especially strong gains for interest rates and meaningful improvements for equities. Series-level comparisons show MV improvements in every case, and error dispersion is generally lower under MV inputs. We also provide parameter-heatmap and time-series visualizations. However, mixing time series across equity and interest rate markets reduces forecast accuracy, indicating that adding noisy context degrades model performance. Overall, the results indicate that foundation models can leverage cross-series information to improve forecast accuracy in finance, and that the benefits are strongest when related series are modeled jointly under disciplined rolling protocols. Other than using an open-source foundation model, this paper also showcases how AI may be used for financial research.
Estimating time-varying correlation matrices is challenging because existing methods may adapt slowly to structural changes, impose insufficient regularization, or produce diffuse posterior uncertainty. In moderate dimensions, an additional difficulty is summarizing the estimated evolving dependence structure for downstream decision-making tasks. We propose a Bayesian approach based on a low-rank factor representation, with latent states evolving under a dynamic shrinkage prior and observation errors following a multivariate factor stochastic volatility model. This specification allows locally adaptive regularization of the estimated correlation structure over time and informative uncertainty quantification. We establish, to our knowledge, a first-of-its-kind posterior contraction result for dynamically regularized Bayesian models, showing contraction around the true model parameters at an explicit rate under averaged Hellinger distance. To summarize the estimated correlation matrices, we build on the information-theoretic concept of total correlation to obtain a scalar measure of cross-sectional dependence. Simulation studies show improved accuracy and responsiveness relative to competing methods in a range of challenging scenarios. We then apply our method to monitoring the correlation evolution of equity portfolios during periods of financial market stress, providing an ex post framework for assessing the changing benefits of diversification in backtesting analyses.
947 days of five-minute bars show gross edges capped below two-point round-trip costs for all fourteen signal families tested
abstractclick to expand
This paper tests whether intraday momentum signals derived from open-high-low-close-volume (OHLCV) data produce a statistically significant trading edge in Micro E-mini Nasdaq 100 futures (MNQ) under realistic execution constraints. Using 947 trading days of five-minute data (2021-2025), fourteen signal families are evaluated, including opening range breakouts, gap strategies, volume signals, cross-session momentum, liquidity grabs, volatility-conditioned classifiers, and news-driven strategies. All signals are assessed using strict institutional criteria: out-of-sample walk-forward validation, minimum T-statistic of 2.0, at least 30 trades, positive net return after a fixed two-point round-trip cost, and multi-year stability. No signal satisfies all criteria simultaneously. The gross edge available to next-bar-open execution is constrained to approximately 0.07-1.50 points per trade, insufficient to overcome transaction costs. A gap-continuation signal achieves T = 3.23 and +14.52 points but fails minimum sample requirements (N = 22). Two validated signals from a separate research program are included as positive controls, confirming the methodology detects genuine edge when present. The primary contribution is a reproducible falsification framework and a documented null result, highlighting structural limits of OHLCV-based intraday strategies.
Financial market forecasting is inherently uncertain, yet most deep learning approaches rely on point predictions that provide only single-value estimates without quantifying uncertainty. Such predictions are insufficient for risk-aware decision-making, as they fail to capture the range of possible outcomes and the associated confidence of forecasts.The problem can be solved using prediction intervals, which allow obtaining an upper and lower bound for the prediction, thus enabling uncertainty representation in the model. Yet, the current methods tend to disregard relationships between assets or cannot simultaneously ensure good calibration and sharpness of the resulting intervals in dynamically changing market regimes. In our work, we propose a spatio-temporal graph-based approach with a bi-level chaotic fusion technique to solve this problem. Our model uses separate nonlinear transformation functions to estimate the interval center and width. Additionally, a volatility-aware gating mechanism is used to make predictions dependent on the regime in which the market operates. Temporal dependencies are considered by embedding graph structures and sequentially modeling them. Training is conducted according to a Lower-Upper Bound Estimation (LUBE) objective. Our experimental results show significant improvements compared to existing baselines (LSTM, GRU, GCN, HGNN) when applied to data from 2016 to 2026 with 43 leading companies in eight sectors of the NSE. It provides the lowest Winkler score (0.0778), tightest prediction intervals (PIAW = 0.1407), and highest coverage (PICP = 96.6%), with all differences statistically significant (p < 0.001) according to the Diebold-Mariano test.
For a phenomenon $\boldsymbol{f}$ that is a function of $n$ factors, defined on a finite abelian group $G$, we derive its population statistics solely from its Fourier transform $\hat{\boldsymbol{f}}$. Our main result is an $m$-Coefficient/Index Annihilation Theorem: the $m$th moment of $\boldsymbol{f}$ becomes a series of terms, each with precisely $m$ Fourier coefficients --- and surprisingly, the coefficient indices in each term sum to zero under group addition. This condition acts like a filter, limiting which terms appear in the Fourier domain, and can reveal deeper relationships between the variables driving $\boldsymbol{f}$. These techniques can also be used as an analytical/design tool, or as a feasibility constraint in search algorithms. For functions defined on $\mathbb{Z}_2^n$, we show how the skew, kurtosis, etc. of a binomial distribution can be derived from the Fourier domain. Several other examples are presented.
We consider a generalization of the variance-gamma (generalized asymmetric Laplace) distribution, defined as a normal mean - variance mixture with a gamma mixing distribution. While this model is typically studied in the univariate setting, we assume that the gamma mixing variable is observed alongside the primary variable, resulting in a bivariate framework. In this setting, maximum likelihood estimation becomes significantly simpler than in the standard univariate case, reducing to a form of classical linear regression. We derive explicit expressions for the resulting estimators. For certain parameter configurations, the estimators exhibit nonstandard convergence rates, exceeding the usual square-root rate. Finally, we illustrate the applicability of this model in financial contexts by analyzing stock index returns and associated volatility for several major indices.
Investor sentiment reflects the collective attitude of investors towards the asset, whether positive, negative or neutral. Market information, such as news and relevant social media posts, plays a significant role in shaping investor sentiment, which influences investment decisions accordingly. The sentiment for one single company may spill over to other relevant companies which are in the same industry. The information spillover network pattern between news and social media may also differ, as they are two different media sources. In this study, we introduce a network-based transfer entropy method to measure and compare the information transmission of news and social media sentiment across the technology companies. We examine whether and to what extent sentiment information from one company can transfer to other companies, and how different the spillover effect is for news and social media. The result signifies a stronger intensity of news information flow among the tech companies after COVID-19. We also highlight the companies which act as information hubs in the sentiment network. Furthermore, we identify the companies which lead the strongest information flow chain. Overall, this study provides a novel perspective in modelling sentiment spillover under two different media sources, and we find that news and social media show a different information transmission pattern during the studied period.
Traditional moving average convergence divergence (MACD) trading rules are often constrained by signal lag and susceptibility to false signals. To address these limitations, this study develops a volume-price-adjusted MACD (VP-MACD) framework that incorporates volume, volatility, and intraday price structure into the conventional indicator, and introduces a sensitivity parameter to allow earlier trade entry and improve responsiveness to market movements. Using the S&P 500, Nasdaq-100, and Dow Jones Industrial Average as representative U.S. equity indices, the model is calibrated over historical records from 2018 to 2022 and evaluated out of sample over 2023 to February 2026. The results indicate that the proposed framework generally delivers better economic performance than the baseline MACD strategy in terms of profitability, risk-adjusted return, and downside-risk control, while generating fewer but more selective trading signals. These findings suggest that incorporating additional market information into technical trading rules may enhance signal quality in U.S. equity index markets.
Asynchronous event-driven markets lack a unique continuous clock, implying incompleteness beyond standard models and needing operational-to-
abstractclick to expand
Financial markets are often modelled as if time were unique and continuous across assets and markets. Financial markets are however asynchronous, order flow is event-driven, and waiting times between events are often random. Many of the most influential formulations of financial market models presuppose a unique global calendar time and advocate for this or that preferred single latent continuous-time price system. Here we critically contrast these assumptions with event-time, renewal, point-process, and order-flow descriptions. We revisit no-arbitrage, no-dynamic-arbitrage, and risk-neutral option pricing in settings where the market is represented as a discrete event system and where the continuum limit of a discrete-time random walk need not be unique. The central suggestion is then that such non-uniqueness points to a more foundational form of market incompleteness than is usually emphasized. This highlights the importance of operational time at the level of decision making but reminds market practitioners that managing risk itself often requires reconciling operational time with a global calendar time. At these longer time scales forms of effective or average completeness may still emerge at lower frequencies and remain useful for portfolio construction and risk management, even if high-frequency hedging and execution expose a clock mismatch between trading, pricing, and longer-horizon allocation.
We propose a Gaussian-copula-based framework that learns deal-level dependence directly from observed joint success frequencies across founder, geography, and market attributes. Holding marginal deal success probabilities fixed, deal-level correlation preserves expected portfolio outcomes but shifts the portfolio distribution toward heavier right tails and higher kurtosis. In portfolio simulations, correlation reduces the probability of modest success counts while sharply amplifying extreme upside outcomes, especially in structurally concentrated portfolios. Our findings suggest that extreme venture capital outcomes may partly reflect correlation-induced tail amplification rather than solely higher average deal quality, with potential implications for portfolio construction and risk management. We note that the observed dataset reflects selected deals with observable outcomes, which inflates apparent success rates relative to the true population base rate; however, the core finding that correlation reshapes the distributional shape while leaving the mean unchanged is structurally robust to the level of marginal success probabilities.
We derive equations of motion for capital deepening in a competitive economy directly from accounting identities, without assuming a production function. A profit imperative $\eta^* \equiv (w/\kappa + 1/\tau)/(1-f_p)$ sets the minimum viable capital productivity, where $\eta = Y/K$ [yr$^{-1}$] is capital productivity, $\kappa = K/L$ is capital per worker, $w$ is the wage rate, $\tau$ is the capital lifetime, and $f_p$ is the production tax share. Four coupled relaxation equations govern $\kappa$, $\eta$, the frontier productivity $\eta_{\rm new}$ of new investment, and the labor share $q \equiv w/y$, with the sandwich constraint $\eta^* \leq \eta_{\rm new} \leq \eta$ maintained as an exact invariant. The frontier equation separates two physically distinct channels: a structural cheapening channel ($\mu$, always active, drives $\eta_{\rm new}$ downward) and a productivity channel ($\phi$, historically zero). Calibration against BEA 2-digit NAICS sector data (1998--2023) confirms $\phi = 0$ for all identifiable sectors over 25 years; the 75-year postwar record extends this finding across four capital lifetimes. A step $\phi = 0.01$\,yr$^{-1}$ -- a 1\%/yr improvement in new-capital productivity, modest but historically unprecedented -- nearly doubles the aggregate growth rate within one capital lifetime, a falsifiable prediction with a precise observable signature: upward-curving $\eta(t)$ in BEA sector data. Firms near the zero-profit threshold have a cash martingale, predicting establishment exit rate $\sim t^{-1/2}$; convolved with the Zipf firm-size distribution~\cite{WP}, this yields firm exit rate $\sim t^{-1/2}\!\log t$ with apparent exponent $b = 0.295 \pm 0.03$, confirmed against BDS data with no free parameters.
The distribution of income and wealth in developed economies exhibits a robust two-class structure: an exponential (Boltzmann--Gibbs) bulk covering $\sim\!97\%$ of the population, and a power-law (Pareto) tail in the upper $\sim\!3\%$. We derive this structure from first principles via an explicit mechanistic chain: Gibrat's law for firm growth implies a Zipf firm-size distribution; maximum entropy applied to within-firm wages, combined with mixture aggregation across firms, yields a Boltzmann--Gibbs income distribution with temperature $T_y$ for employees; additive-noise wealth dynamics with a reflecting wall at zero produce a Boltzmann--Gibbs employee wealth distribution with temperature $T_w$. For firm owners, multiplicative capital returns produce a Pareto wealth tail with exponent $\alpha_w = 1/\theta$, where $\theta$ encodes how total returns scale with firm size. The empirical value $\alpha_w \approx 1.30$ \cite{Yakovenko2009} is reproduced with no tuned parameters from the observed firm value scaling $V = V_0(s/s_0)^{0.77}$~\cite{Axtell2001}, and simultaneously yields the first quantitative estimate of the returns-per-employee size exponent: $\zeta = \theta - 1 \approx -0.23$. For empirical values $\nu \approx 0.3$, $c \approx 0.81$, $k \approx 0.15$ (BEA long-run savings rate $\approx 5\%$), the model gives $T_w/T_y \approx 1.7\,\text{yr}$, i.e.\ lower-class households hold roughly 1--2 years of income as wealth, with the precise ratio depending on savings and tax rates and testable cross-country. As a parameter-free empirical test, firms near zero profit have a cash martingale whose first-passage time gives establishment exit rate $\sim t^{-1/2}$; convolving with the Zipf firm-size distribution yields firm-level exit rate $\sim t^{-1/2}\!\log t$, with apparent exponent $b = 0.295 \pm 0.03$, confirmed against BDS firm-age data with no free parameters.
Electricity price forecasting supports decision-making in energy markets and asset operation. Probabilistic forecasts are increasingly adopted to explicitly quantify uncertainty, typically issued as quantile predictions or ensembles of the full predictive distribution. However, how improvements in statistical forecast quality translate into economic value remains unclear. Battery storage arbitrage in day-ahead markets is a popular application-based benchmark for this purpose. We analyze quantile-based trading strategies (QBTS) and identify two critical flaws: they do not incentivize honest probabilistic forecasting and they ignore the intertemporal dependence structure of electricity prices. We therefore frame battery optimization as a stochastic program based on fully probabilistic forecasts and examine decision quality measurement for risk-neutral and risk-averse settings under different uncertainty models. Our discussion touches both sides of the coin: How reliable is the economic evaluation of forecasting models though (simplified) application studies - and how do improvements in statistical forecast quality for stochastic programs relate to the decision-quality and economic performance? We provide theoretical justification and empirical evidence from a case study on the German electricity market. Our results highlight the pitfalls of ranking forecasting models through battery trading strategies. We conclude with implications for evaluation practice and directions for future research in application-based forecast assessment.
Text-based financial networks are increasingly used to study cross-stock return predictability. A common approach constructs links from similarities in firms' disclosure embeddings, but such networks often contain spurious edges because textual proximity does not necessarily imply economic connection. We propose a two-stage framework that first builds a sparse candidate graph from 10-K embeddings and then uses a large language model to classify and filter candidate edges according to their economic relations. The refined graph is used to aggregate pair-level mean-reversion signals into stock-level trading signals with relation-aware and distance-based weights. In a backtest on S&P 500 constituents from 2011 to 2019, LLM-based edge filtering improves the long-short Sharpe ratio from 0.742 to 0.820 and reduces maximum drawdown from $-$10.47% to $-$7.85%. These results suggest that LLM-based reasoning can improve the economic fidelity of text-derived financial networks and strengthen cross-stock predictability.
We identify a robust structural signature of stock markets during exogenous shock events by analyzing collective return dynamics across G5 countries. Using Random Matrix Theory, we introduce the complexity gap, defined as the difference between the normalized largest eigenvalue and the average pairwise correlation, to quantify changes in market structure. This measure reveals a consistent three-phase pattern across multiple shocks, including the 2025 U.S. tariff event, the COVID-19 crisis, and country-specific shocks in Japan and China during 2024. Before a shock, markets show a positive complexity gap, reflecting a rich structure with multiple interacting factors. During shocks, the gap collapses to near zero, signaling strong synchronization under a single dominant mode. Post-shock recovery follows a nonmonotonic path: an initial widening (a false recovery), a temporary recollapse, and final sustained restoration. This pattern holds at both market and sector levels and across global and local shocks. Ordinal entropy analysis confirms the same sequence of collapse and false recovery in directional diversity. We further demonstrate that lower complexity gap values predict higher future portfolio volatility, especially after shocks, establishing its value as a state-dependent risk indicator. For investors, initial gap widening may mislead, while sustained widening signals genuine structural stabilization. These findings reveal a robust structural signature governing financial market dynamics during crisis and recovery periods.
We present the first portfolio-level validation of MarketSenseAI, a deployed multi-agent LLM equity system. All signals are generated live at each observation date, eliminating look-ahead bias. The system routes four specialist agents (News, Fundamentals, Dynamics, and Macro) through a synthesis agent that issues a monthly equity thesis and recommendation for each stock in its coverage universe, and we ask two questions: do its buy recommendations add value over both passive benchmarks and random selection, and what does the internal agent structure reveal about the source of the edge? On the S&P 500 cohort (19 months) the strong-buy equal-weight portfolio earns +2.18%/month against a passive equal-weight benchmark of +1.15% (approximating RSP), a +25.2% compound excess, and ranks at the 99.7th percentile of 10,000 Monte Carlo portfolios (p=0.003). The S&P 100 cohort (35 months) delivers a +30.5% compound excess over EQWL with consistent direction but formal significance not reached, limited by the small average selection of ~10 stocks per month. Non-negative least-squares projection of thesis embeddings onto agent embeddings reveals an adaptive-integration mechanism. Agent contributions rotate with market regime (Fundamentals leads on S&P 500, Macro on S&P 100, Dynamics acts as an episodic momentum signal) and this agent rotation moves in lockstep with both the sector composition of strong-buy selections and identifiable macro-calendar events, three independent views of the same underlying adaptation. The recommendation's cross-sectional Information Coefficient is statistically significant on S&P 500 (ICIR=+0.489, p=0.024). These results suggest that multi-agent LLM equity systems can identify sources of alpha beyond what classical factor models capture, and that the buy signal functions as an effective universe-filter that can sit upstream of any portfolio-construction process.
Combining CNN feature extraction, transformer attention, and LSTM memory yields higher accuracy than single-model methods on stock data.
abstractclick to expand
Shanghai Composite Index prediction has become a hot issue for many investors and academic researchers. Deep learning models are widely applied in multivariate time series forecasting, including recurrent neural networks (RNN), convolutional neural networks (CNN), and transformers. Specifically, the Transformer encoder, with its unique attention mechanism and parallel processing capabilities, has become an important tool in time series prediction, and has an advantage in dealing with long sequence dependencies and multivariate data correlations. Drawing on the strengths of various models, we propose the CNN-Transformer-LSTM Networks (CTLNet). This paper explores the application of CTLNet for Shanghai Composite Index prediction and the comparative experiments show that the proposed model outperforms state-of-the-art baselines.
 full image