From Classical Optimization to Bayesian Integration: A Comprehensive Analysis of Systematic Portfolio Management
Pith reviewed 2026-06-28 23:56 UTC · model grok-4.3
The pith
The Black-Litterman model produces more economically intuitive and stable portfolio allocations than standard mean-variance optimization by balancing equilibrium returns with investor views.
A machine-rendered reading of the paper's core claim, the machinery that carries it, and where it could break.
Core claim
Testing mean-variance optimization, constrained variants, Fama-French regressions, Monte Carlo simulation, and the Black-Litterman model on identical data shows that the Bayesian integration in Black-Litterman avoids the extreme concentrations and instability of classical optimization while incorporating investor opinions in a coherent way.
What carries the argument
The Black-Litterman model, which combines equilibrium market returns with investor views through a Bayesian updating process.
If this is right
- Standard mean-variance optimization produces highly concentrated portfolios.
- Constrained optimization changes portfolio allocations by altering the efficient frontier.
- Fama-French five-factor models suggest defensive large-value and profitability exposure as a basic investment style.
- Monte Carlo simulation is a viable technique for mean-variance optimal portfolios when simulations are high enough under a box constraint.
- Black-Litterman yields more economically intuitive allocations and greater stability by balancing equilibrium returns with investor views.
Where Pith is reading between the lines
- The stability advantage may become more pronounced when applied to larger stock universes or multi-asset portfolios.
- Institutional investors facing regulatory constraints could see different trade-offs between classical and Bayesian methods than retail users.
- Testing across multiple market regimes would clarify whether the reported stability holds mainly in calm or volatile periods.
- Combining Black-Litterman with factor constraints might further reduce turnover while preserving the intuitive allocations.
Load-bearing premise
Observed differences in concentration, stability, and economic intuition arise from the modeling choices themselves rather than from the particular choice of ten stocks or the September 2023–December 2025 window.
What would settle it
Re-running the identical comparisons on a different set of stocks or over a different time window and finding that the Black-Litterman advantages in intuition and stability disappear or reverse.
Figures


read the original abstract
This paper compares a series of contemporary portfolio construction approaches by employing ten U.S. stocks (TSLA, WMT, BAC, GS, LLY, MRK, GOOG, META, AAPL and XOM) in a time frame from September 2023 to December 2025. The paper explores both basic mean-variance optimization, constrained optimization, Fama French five factor regression modeling, Monte Carlo simulation, and the Black-Litterman model to determine how constraints to a solution, risk factors to a strategy, simulated approximations, and specific market views may all impact the outcome of portfolio allocation, performance and stability. Overall, the results show that standard optimization may result in highly concentrated portfolios, while constrained optimization leads to changes in portfolio allocations by altering the efficient frontier, five factor regression models suggest that a basic investment style of defensive large value and profitability exposure, Monte Carlo approximation is a viable technique to arrive at mean-variance optimal portfolios provided the simulations are high enough especially under a box constraint, the Black Litterman portfolio approach produces more economically intuitive allocations and greater stability compared to standard mean-variance optimization as the approach balances equilibrium returns with investor views.
Editorial analysis
A structured set of objections, weighed in public.
Referee Report
Summary. The manuscript compares several portfolio optimization methods—including mean-variance optimization, constrained optimization, Fama-French five-factor regression, Monte Carlo simulation, and the Black-Litterman model—using a fixed universe of ten U.S. stocks (TSLA, WMT, BAC, GS, LLY, MRK, GOOG, META, AAPL, XOM) over the period September 2023 to December 2025. It concludes that standard mean-variance optimization produces highly concentrated portfolios, while the Black-Litterman approach yields more economically intuitive allocations and greater stability by balancing equilibrium returns with investor views.
Significance. If the reported advantages of the Black-Litterman model hold under more general conditions, the work would offer useful empirical insights into the practical differences between classical and Bayesian portfolio construction techniques, potentially informing practitioners on when to prefer one approach over others.
major comments (2)
- [Abstract] Abstract: The central claim that Black-Litterman produces more economically intuitive allocations and greater stability is based solely on comparisons within one specific set of ten stocks and a single ~28-month interval. No robustness checks across alternative asset universes, different time periods, or out-of-sample validation are mentioned, which is load-bearing for generalizing the modeling advantage.
- [Abstract] Abstract: The abstract provides no implementation details, data sources, error bars, robustness checks, or statistical significance tests, making it impossible to verify whether the reported differences in concentration, stability, and performance support the stated conclusions.
minor comments (1)
- [Abstract] The abstract contains run-on sentences and unclear phrasing when summarizing the results for each method.
Simulated Author's Rebuttal
We thank the referee for the constructive feedback. We address the two major comments on the abstract point by point below and will revise the abstract to improve transparency and scope clarification.
read point-by-point responses
-
Referee: [Abstract] Abstract: The central claim that Black-Litterman produces more economically intuitive allocations and greater stability is based solely on comparisons within one specific set of ten stocks and a single ~28-month interval. No robustness checks across alternative asset universes, different time periods, or out-of-sample validation are mentioned, which is load-bearing for generalizing the modeling advantage.
Authors: We agree that the reported results are specific to the ten-stock universe (TSLA, WMT, BAC, GS, LLY, MRK, GOOG, META, AAPL, XOM) and the September 2023–December 2025 window. The manuscript frames this as an empirical case study rather than a general claim of superiority. We will revise the abstract to explicitly state the limited scope and note the absence of robustness checks or out-of-sample tests, thereby avoiding any implication of broader generalizability. revision: yes
-
Referee: [Abstract] Abstract: The abstract provides no implementation details, data sources, error bars, robustness checks, or statistical significance tests, making it impossible to verify whether the reported differences in concentration, stability, and performance support the stated conclusions.
Authors: We will expand the abstract to specify the asset universe, sample period, data source (daily adjusted closing prices), and the deterministic nature of the optimizations. Because the comparisons rely on point estimates from closed-form or simulation-based solutions rather than stochastic processes, error bars and statistical significance tests are not applicable; we will note this explicitly. The revised abstract will also reference the lack of robustness checks already addressed in the first response. revision: yes
Circularity Check
No circularity; pure empirical side-by-side comparison on fixed data
full rationale
The manuscript performs a direct empirical comparison of mean-variance optimization, constrained optimization, Fama-French regression, Monte Carlo simulation, and Black-Litterman on one fixed set of ten named stocks over one 28-month window. No equations, parameter fits presented as predictions, self-citations, or ansatzes are invoked to derive the central claim; the reported differences in concentration, stability, and intuition are simply tabulated outputs from the chosen methods on the chosen data. This is self-contained descriptive work with no derivation chain that could reduce to its own inputs by construction.
Axiom & Free-Parameter Ledger
free parameters (3)
- risk aversion parameter
- number of Monte Carlo draws
- box constraint bounds
axioms (2)
- domain assumption Returns are approximately normally distributed or can be adequately summarized by mean and covariance.
- domain assumption Fama-French five factors capture the relevant risk premia for the chosen stocks.
Reference graph
Works this paper leans on
-
[1]
Since then, investors have aimed to generate portfolios with maximum expected return and lowest possible risk given their level of risk tolerance
Introduction The problem of portfolio optimization has been a staple in the quantitative finance research com- munity since the development of the Modern Portfolio Theory by Markowitz in 1952. Since then, investors have aimed to generate portfolios with maximum expected return and lowest possible risk given their level of risk tolerance. This mean-varianc...
1952
-
[2]
The set of best-performing portfolios for any amount of risk is known as the efficient frontier
Literature Review Markowitz’s contribution to mean-variance optimization theory, which treats portfolio diversifica- tion as an optimization problem (Markowitz), forms the theoretical basis of portfolio optimization. The set of best-performing portfolios for any amount of risk is known as the efficient frontier. Sharpe built on this theory with his work t...
-
[3]
Furthermore, the out-of-sample evaluation period of October 1, 2025 to December 31, 2025, was adopted to assess the performance of all constructed portfolios
Data and Methodology 3.1 Data Description The study examines the following ten securities: TSLA, WMT, BAC, GS, LLY, MRK, GOOG, META, AAPL, XOM To compute the returns, we retrieved the adjusted daily closing stock prices of the underlying assets on Yahoo Finance for the estimation period of September 1, 2023 to September 30, 2025. Furthermore, the out-of-s...
2023
-
[4]
corner portfolio
Mean-Variance Portfolio Optimization 4.1 Unconstrained MVO and the Corner Portfolio Problem The initial optimization framework implemented in this study solves for theGlobal Minimum Vari- ance (GMV)a portfolio which is not necessarily the tangent portfolio. Whereas the tangent portfolio gives the Sharpe maximising portfolio as it simultaneously minimizes ...
2025
-
[5]
systematic
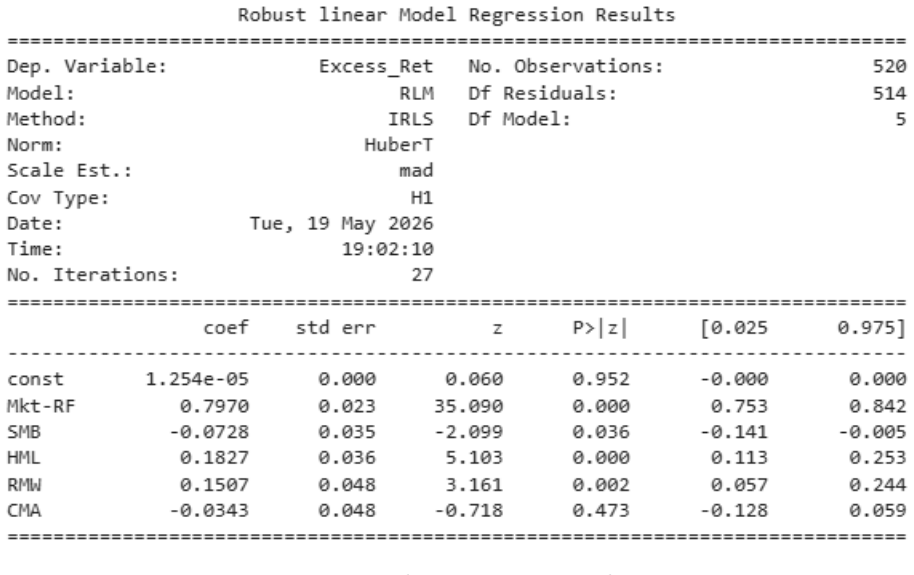
Fama-French Five-Factor Analysis We then took the resulting portfolio from the constrained optimization part and ran it through the Fama-French Five-Factor Model: E[Rp]−R f =α+β 1(Rm −R f) +β 2SM B+β 3HM L+β 4RM W+β 5CM A+ϵ The five factors represent: •Market Risk Premium (R m −R f) : This factor reflects the portfolio’s "systematic" risk exposure, or its...
2023
-
[6]
quasi-random
Factor Exposure Analysis of the Constrained Portfolio As the regression results reveal, a significant fraction of the constrained portfolio’s excess return variation is explained by the Fama-French factors. TheR2 of the OLS regression is greater than 70%. In economic terms, this indicates that variation in the constrained portfolio’s returns results from ...
2099
-
[7]
Rest of the S&P 500
Black-Litterman Model TheBlack-Litterman(BL)modelwasthefinalstepintheanalysis, whichbroughtinvestorviewsinto the mean-variance problem while maintaining consistency with the market equilibrium returns. In contrast with conventional mean-variance optimization, the BL model merges information related to the market equilibrium and returns with information of...
-
[8]
A relative view stating that AAPL is expected to outperform GOOG by 2%
-
[9]
Rest of the S&P 500
An absolute view forecasting a 10% return for TSLA. The relative view, with respect to the first row of thePmatrix, has a weight of+1for AAPL and a weight of−1for GOOG. The absolute view for TSLA has a weight of+1for TSLA and zero for the remaining tickers. The uncertainty matrixΩis derived using the approach suggested in He-Litterman, where the diagonal ...
-
[10]
As before, classical mean-variance allocation techniques are highly dependent on expected returns and lead to many corner portfolios
Discussion The results of this study suggest multiple key implications for contemporary portfolio management and for building systematic asset allocation strategies. As before, classical mean-variance allocation techniques are highly dependent on expected returns and lead to many corner portfolios. Although these mean-variance efficient portfolios are the...
-
[11]
equity market across optimization, factor modeling, simulation, and Bayesian allocation models
Conclusion This study tested different portfolio approaches in the U.S. equity market across optimization, factor modeling, simulation, and Bayesian allocation models. The results of the empirical study suggest that optimizing portfolios without any restrictions led to portfolios that were too concentrated in a select number of assets, which is difficult ...
-
[12]
References Black, F., and Litterman, R. (1992). Global Portfolio Optimization. Financial Analysts Journal, 48(5), 28–43. Fama, E. F., and French, K. R. (2015). A Five-Factor Asset Pricing Model. Journal of Finan- cial Economics, 116(1), 1–22. Glasserman, P. (2004). Monte Carlo Methods in Financial Engineering. Springer. Markowitz, H. (1952). Portfolio Sel...
1992
discussion (0)
Sign in with ORCID, Apple, or X to comment. Anyone can read and Pith papers without signing in.