pith. sign in

stat.AP

Applications

Biology, Education, Epidemiology, Engineering, Environmental Sciences, Medical, Physical Sciences, Quality Control, Social Sciences

Top Pith
2
cs.LG 2026-05-06

Hybrid graph-SVR model boosts urban air pollution forecasts

by Nourin Jahan, Madhurima Panja +2 more

Graph Convolutional Support Vector Regression for Robust Spatiotemporal Forecasting of Urban Air Pollution

The method outperforms benchmarks in Delhi and Mumbai while staying stable during spikes and seasons and adding uncertainty estimates.

Figure from the paper full image
abstract click to expand
Urban air quality forecasting is challenging because pollutant concentrations are nonlinear, nonstationary, spatiotemporally dependent, and often affected by anomalous observations caused by traffic congestion, industrial emissions, and seasonal meteorological variability. This study proposes a Graph Convolutional Support Vector Regression (GCSVR) framework for robust spatiotemporal forecasting of urban air pollution. The model combines graph convolutional learning to capture inter-station spatial dependence with support vector regression to model nonlinear temporal dynamics while reducing sensitivity to outlier observations. The proposed framework is evaluated using air quality records from 37 monitoring stations in Delhi and 18 stations in Mumbai, representing inland and coastal metropolitan environments in India. Forecasting performance is assessed across multiple horizons and compared with established temporal and spatiotemporal benchmarks. The results show that GCSVR consistently improves predictive accuracy and maintains stable performance across seasons and outlier-prone pollution episodes. Statistical test further confirms the reliability of the proposed approach across the two cities. Finally, conformal prediction is integrated with GCSVR to generate calibrated prediction intervals, enhancing its practical value for uncertainty-aware air quality monitoring and public health decision-making.
0
0
cs.AI 2026-07-03

Simple threshold monitor matches advanced LLM safety checks

by Mona Schirmer, Metod Jazbec +4 more

Online Safety Monitoring for LLMs

Risk-calibrated thresholding on external verifier signals performs competitively on reasoning and red teaming tasks.

Figure from the paper full image
abstract click to expand
Despite alignment training, LLMs remain prone to generating unsafe outputs at deployment time. Monitoring outputs online and raising an alarm when safety can no longer be assumed is therefore critical. We study a simple real-time monitor that turns a verifier signal from an external model into an alarm decision by thresholding, with the threshold calibrated via risk control. In experiments on mathematical reasoning and red teaming datasets, we show that this simple design is competitive with more advanced monitors based on sequential hypothesis testing.
0
0
stat.AP 2026-07-03

CESM low-energy matches contrast at 0.874 patient AUC

by Sara Antonijevic, Brani Vidakovic

Masked complex non-decimated wavelet features for patient-level classification of contrast-enhanced mammography

Leakage-free wavelet classifier shows the two image types are equivalent yet use separate phase and magnitude channels.

Figure from the paper full image
abstract click to expand
Contrast-enhanced spectral mammography (CESM) acquires two images of each breast, a low-energy image and a recombined contrast image, but two questions central to building a classifier on them remain unsettled: whether the two image types carry comparable malignancy signal, and how a patient's several images should be combined into a single decision. Both are hard to answer reliably, because most published CESM classifiers split cross-validation folds at the image level, letting images of the same patient fall in both training and test sets and inflating reported performance. We pair a masked complex non-decimated wavelet feature bank with an elastic-net logistic classifier, evaluated under repeated patient-grouped nested cross-validation with patient-cluster bootstrap inference on the CDD-CESM dataset (1,880 images, 308 patients); under this leakage-free evaluation the inflation from testing on previously seen patients is negligible. On normal-versus-malignant detection, the two acquisitions are statistically indistinguishable in patient-level AUC under the proposed evaluation framework. Under single-image fusion the contrast image reaches a patient-level AUC of 0.874 (95% CI 0.827-0.918) and the low-energy image is statistically indistinguishable from it, yet the two encode malignancy through disjoint, interpretable channels: phase coherence on the low-energy image and magnitude distribution on the contrast image. The framework matches a pretrained ResNet-50 representation at the patient level, but whereas the frozen deep representation is not directly interpretable at the level of individual predictors, every predictor in the wavelet representation carries an explicit physical meaning. The result is a transparent, leakage-free baseline against which future CESM classifiers can be measured.
0
0
stat.AP 2026-07-03

iDiD estimator lets time-constant direct effects count as valid instruments

by Tran Trong Khoi Le, Emilie Sbidian +1 more

Instrumented difference-in-differences under case-control sampling

After modeling retrospective sampling bias, instruments whose direct outcome effect does not change over time identify trend effects in case

Figure from the paper full image
abstract click to expand
Case-control designs are fundamental in epidemiology for the efficient study of rare outcomes. Although instrumental variable (IV) methods have been extended to this setting to address unmeasured confounding, they typically rely on the exclusion restriction assumption, which may be violated when the IV candidates directly affect the outcome through pathways independent of the exposure. In this paper, we propose a novel instrumented difference-in-differences (iDiD) approach tailored to case-control designs. Grounded in structural mean modeling, the proposed method accommodates IV candidates that have time-invariant direct effect on the outcome. When retrospective case-control datasets are collected, the candidate can still be used as a valid instrument on the trend scale when selection bias induced by retrospective sampling is efficiently taken into account. We assess finite-sample performance of this method through extensive simulations, then apply it to evaluate the risk of serious infection of biologic treatments for psoriasis, using French national claim database.
0
0
stat.AP 2026-07-03

EVPI extensions show global validation of ADNEX model is complete

by Laure Wynants, Kim Zhipei Wang +6 more

Value-of-Information Analysis for External Validation of Risk Prediction Models in Multicenter Studies and Systematic Reviews

Accounting for center differences reveals when local adoption decisions still need more data to confirm net benefit.

Figure from the paper full image
abstract click to expand
External validation studies have finite sample sizes, creating uncertainty about whether a prediction model's Net Benefit (NB) exceeds default strategies' NB. The expected value of perfect information (EVPI) quantifies consequences of uncertainty. Current EVPI methods focus on single studies, ignoring between-center heterogeneity. We extend EVPI and expected value of partial perfect information (EVPPI) to account for between-cluster heterogeneity in multicenter studies and meta-analyses. We distinguish between the global and local optimal strategy and between observed and unobserved clusters. We define EVPIglobal, EVPIcluster_j, EVPIcluster, and EVPPIcluster,prevalence, implemented in the MetaNB R package, and illustrate them using a systematic review across 36 centers of the ADNEX model for ovarian cancer diagnosis. Assuming one global decision regarding ADNEX adoption, there is no need for further data to confirm ADNEX is superior overall (EVPIglobal 0). Meta-analysis borrows information across observed clusters, resulting in consistent local superiority of ADNEX and nonzero but typically lower EVPIcluster_j than when considering local data alone. There is 0.03 probability default strategies are superior in unobserved centers. Eliminating uncertainty on performance and prevalence in each (EVPIcluster) would gain 1134 net avoided false positives (FP) per year, assuming 350000 tumors annually with 20% malignancies. Determining only local prevalence with certainty (EVPPIcluster, prevalence) would gain net 158 avoided FP per year. EVPI extensions disentangle sources of uncertainty and quantify the need for further validation to determine the global or locally optimal strategy. Considering uncertainty and heterogeneity in clinical utility across clusters is essential to decide whether additional validation studies are warranted.
0
0
stat.AP 2026-07-03

Quaternion wavelets classify breast histology into four classes

by Sara Antonijevic, Brani Vidakovic

Quaternion Nondecimated Wavelet Descriptors for Multiclass Breast Histology Classification

Color-coupled nondecimated transforms produce balanced accuracy on BACH data without pretrained networks or external data.

Figure from the paper full image
abstract click to expand
Breast histology images carry diagnostic information in color, texture, orientation, and tissue architecture across a range of scales. In H&E microscopy this information is inherently chromatic and is not fully recovered when the red, green, and blue (RGB) channels are reduced to grayscale or transformed as independent scalar images. We propose an interpretable quaternion nondecimated wavelet framework for breast histology classification. Each RGB image is encoded as a pure quaternion field, and a quaternion nondecimated wavelet transform in two dimensions (QNDWT2D) produces multiscale, directional, color-coupled coefficient fields on the original image grid, keeping color as a single vector quantity rather than three separate channels. From these coefficients we build interpretable feature families summarizing stain balance, wavelet energy, amplitude heterogeneity, quaternion phase concentration, color-axis geometry, directional anisotropy, orientation entropy, and scale-dependent energy decay, each tied to a histopathological property such as nuclear density or glandular organization. We evaluate the descriptors on the BreAst Cancer Histology (BACH) challenge, a balanced four-class set of normal, benign, in situ, and invasive tissue, using a radial-kernel support vector machine (SVM) with repeated nested cross-validation. The descriptors yield balanced recognition across classes, with errors concentrated among adjacent categories while normal and invasive are rarely reversed. Permutation importance shows that directional, phase-concentration, anisotropy, scale, and amplitude-variability groups all contribute, indicating that the classifier draws on genuine quaternion and multiscale geometry rather than global color alone. The framework uses no pretrained networks, learned filters, or external databases, offering a reproducible, interpretable baseline for computational pathology.
0
0
cs.LG 2026-07-03

Conformal prediction flags 15 percent of samples but detects zero traction incidents

by Varshith Roy Kotla

Predictive Conformal Slip Monitoring: An Empirical Evaluation of Rolling Split Conformal Prediction for Pre-Incident Traction Loss Detection

Evaluation across 19 drivers shows the rolling-volatility method matches a simple threshold while violating its core exchangeability assumpt

abstract click to expand
Conventional traction control architectures intervene only after the adhesion limit of a tire has already been breached. This paper investigates whether Rolling Split Conformal Prediction , monitoring the volatility of non-conformity residuals from a per-driver Random Forest model of expected slip behavior , can serve as a statistically grounded pre-incident warning signal, ahead of gross traction loss. Unlike an earlier internal draft of this work, the evaluation reported here corrects a confound in the slip proxy (vehicle speed is included as an explicit model feature, not left implicit in the target's denominator), uses every racing lap for each driver rather than only the fastest lap, and is scored against real, timestamped incident labels extracted from FIA Race Control Messages and track-limits lap deletions rather than narrated post-hoc. The result is negative: across 19 drivers and 55,563 test-phase telemetry samples, the rolling-volatility detector achieves a mean precision of essentially 0.0 and mean recall of 0.0 against 14 ground-truth incidents, while flagging on average 15.3% of all samples as anomalous , too high a false-alarm rate for any early-warning use. A static 95th-percentile threshold baseline performs no better in any way that would justify the added complexity of the conformal-volatility formulation. Residual autocorrelation diagnostics show the split-conformal exchangeability assumption is violated for every driver (Ljung-Box p < 0.001, n = 19/19), which is one plausible driver of the high false-alarm rate. We report this as a methodologically rigorous negative finding, diagnose its likely causes, and outline what a genuinely predictive version of this approach would require.
0
0
stat.AP 2026-07-03

Probit BKMR fits in bkmr rarely converge

by Akifumi Eguchi, Takayuki Kawashima +2 more

Convergence fragility in probit Bayesian kernel machine regression implemented in the bkmr R package for binary-outcome environmental mixture analyses: a simulation study

Simulation of 431 tasks found only 30 met R-hat ≀ 1.01 and ESS β‰₯ 400, so report full diagnostics instead of fit success alone.

abstract click to expand
Background. Bayesian kernel machine regression (BKMR) is widely used for exposure-mixture analyses with binary outcomes through a probit extension. Because a bkmr fit can complete without providing adequate effective posterior information, simulation studies should separate execution success from MCMC convergence diagnostics. Methods. We evaluated the public bkmr probit workflow using bkmr::SimData() for data generation, bkmr::kmbayes() for model fitting, and posterior for convergence diagnostics. The balanced generator used family = "binomial", hfun = 2, beta.true = 0.5, ind = 1:2, and M = 4. SimData() generated the covariate as X = 3*cos(z1) + 2*rnorm(n). Four chains were initialized with chain-specific randomized starting values generated reproducibly from the fixed initial-value base seed 20260621. These values affected only the initial state of the sampler and did not alter the BKMR model, default priors, or Metropolis-Hastings proposals. Results. Of 431 prespecified tasks, 430 returned fitted objects and one task had a numerical non-completion. Diagnostic adequacy was limited: rank-normalized R-hat <= 1.01 threshold was achieved in 55/431 tasks, bulk-ESS >= 400 in 85/431, tail-ESS >= 400 in 44/431, and both ESS criteria in 44/431. The primary diagnostic criterion, R-hat at or below the 1.01 threshold with both bulk-ESS and tail-ESS >= 400, was met in 30/431 prespecified tasks, corresponding to 30/430 completed fits. Conclusions. Completion of probit BKMR fits in bkmr should not be equated with convergence of the retained MCMC draws. Applied analyses should report the number of chains, warmup and retained iterations, rank-normalized R-hat, bulk-ESS, and tail-ESS rather than rely on a fixed iteration count or on fit completion alone.
0
0
stat.AP 2026-07-03

IRT model extracts rider skill and condition difficulty from binary outcomes

by Fabio Carucci

Inverse Suitability: Identifying Condition Difficulty and Rider Skill from Behavioural Outcomes via Continuous-Item Response Theory

Continuous-item formulation recovers skill at r=0.96 and improves Brier score by 0.33 over expert curves on synthetic cohort of 80 riders.

Figure from the paper full image
abstract click to expand
Suitability scoring for outdoor activities (kitesurfing, paragliding, ski touring) maps environmental conditions to a go/no-go verdict via expert-defined curves. These curves conflate two distinct quantities: the intrinsic difficulty of a condition and the skill of the person facing it. We introduce Inverse Suitability, a continuous-item Item Response Theory (IRT) model that identifies both from behavioural outcomes alone. Each outcome is a triple (rider r, condition metric x at site s, binary outcome y); we model P(y=1) = sigma(a (theta_r - delta(x, s))), where theta_r is latent rider skill, delta(x, s) is a latent difficulty function anchored to a physics-derived expert curve as its prior, and a is a discrimination parameter. The formulation is strictly more general than a single suitability curve, which it recovers exactly when skill is integrated out under the population distribution. Parameters are estimated by marginal maximum likelihood with Gauss-Hermite quadrature; identification holds when the rider-by-condition incidence graph is connected, with a documented single-curve fallback otherwise. We validate via synthetic recovery: on a reference cohort (80 riders times 30 outcomes) the model recovers latent skill at r = 0.96, locates the difficulty minimum within 3 units of ground truth, and improves held-out Brier Skill Score by +0.33 over the expert-curve baseline. The recovered difficulty function defines a measurable, site-level construct, an intrinsic difficulty atlas, that existing meteorological observation networks do not capture. All results reproduce from a single command on synthetic data, requiring no proprietary observations.
0
0
stat.AP 2026-07-03

Glicko-2 extended with margin and draw models for football

by Bich Van Nguyen, Nam Anh Tran

An Adaptive Glicko-2 Rating Framework for Probabilistic Football Forecasting and Season Simulation

Dynamic ratings plus ordered-logit probabilities feed Monte Carlo simulations of remaining league fixtures.

Figure from the paper full image
abstract click to expand
Football match outcome prediction is a challenging problem because team strength changes over time, match outcomes contain a high level of randomness, and draws play a central role in the result structure. Classical rating systems such as Elo provide simple and interpretable dynamic summaries of team ability, but they do not explicitly model uncertainty and often ignore football-specific contextual information. This paper proposes an adaptive Glicko-2-based rating framework for probabilistic football forecasting and leaguelevel season simulation. The proposed framework extends the standard Glicko-2 model by incorporating football-specific mechanisms, including margin-of-victory adjustment, dominance weighting, structural shocks, home advantage modelling, and an ordered-logit draw model. The framework estimates latent team strength dynamically, converts rating differences into win-draw-loss probabilities, and uses these probabilities to simulate the remaining part of a league season through Monte Carlo sampling.
0
0
stat.ME 2026-07-03

Transportability estimates effect changes from modifier prevalence shifts

by Michael Cheung, Candus Shi +4 more

From Subgroups to Population Composition: A Transportability Approach to Effect Heterogeneity

Modeling effects in hypothetical populations with shifted prevalences ranks characteristics by their link to differential vulnerability.

Figure from the paper full image
abstract click to expand
Identifying heterogeneous populations across which exposure effects vary is essential for transportability applications, cost-benefit analyses, and intervention prioritization. Traditional methods for heterogeneity analyses rely on parametric regression with prespecified subgroups, which may fail to capture complex patterns of effect modification. While recent data-adaptive methods improve high-dimensional heterogeneous effect prediction, they add methodological complexity to analyses and may offer limited insight into key drivers of heterogeneity. In this paper, we propose a novel, conceptual approach for heterogeneity analyses that considers how exposure effects would differ in populations with different compositions by modeling the population-level effect surface as a function of the distribution of effect modifiers. The approach consists of three steps: i) selecting confounders and effect modifiers based on prior knowledge (or alternatively using data-adaptive methods to learn effect modifiers), ii) estimating exposure effects in hypothetical populations with different effect modifier prevalences using transportability methods, and iii) modeling the estimated effects as a function of prevalence values. This approach provides two types of outputs: estimation of the change in the population-level exposure effects attributable to increases in effect modifier prevalence and ranking of effect estimates across multiple effect modifiers and prevalences to identify population characteristics most strongly associated with differential vulnerability. We demonstrate the approach using Demographic and Health Surveys data to examine heterogeneous effects of drought on child stunting and provide a Shiny application to implement this approach in any setting.
0
0
stat.ME 2026-07-03

Lancaster copulas arise from orthogonal expansions of Lancaster probabilities

by Angelo Efoevi Koudou, Yves I. Ngounou Bakam +1 more

Lancaster copulas

The construction supplies infinite series for the copula and density whose low-order truncations already match target dependence in numerica

Figure from the paper full image
abstract click to expand
We introduce a new copula class, called Lancaster copulas, built from orthogonal expansions of continuous Lancaster probabilities. We derive infinite-series representations for the copula and its density, study truncation effects, and show in numerical experiments that low-order truncations already provide accurate approximation.
0
0
stat.AP 2026-07-02

Kernel norm spots PV faults at 99% accuracy without labels

by Victoria Jorry, Zina-Sabrina Duma +3 more

An unsupervised kernel norm monitoring for fault detection in a time series photovoltaic system

KNM maps normal data windows into kernel space to flag sensor and shading issues in solar systems better than standard baselines.

Figure from the paper full image
abstract click to expand
Grid-connected photovoltaic systems (GCPVS) are generally robust but remain susceptible to faults that can compromise energy conversion efficiency or raise safety concerns. Promptly and automatically detecting such anomalies is therefore essential for maintaining system reliability and performance. However, in practice, labeled fault data are rarely available in real-world deployments, which limits the applicability of supervised approaches. Conventional unsupervised baseline models, including a one-class support vector machine (OCSVM), isolation forest (iForest), and local outlier factor (LOF), are trained on normal operation data and assign anomaly scores reflecting how closely new observations resemble that baseline. Although these methods already accommodate non-linear behavior to varying degrees, kernel-based formulations offer further flexibility in shaping the decision boundary; however, tuning the kernel hyperparameters ordinarily requires some prior knowledge of the fault regime. We overcome this limitation by proposing kernel-based norm monitoring (KNM), a non-linear, unsupervised, window-based fault-detection method designed for continuous processes. Although the paper focuses on the GCPVS as a case study, KNM is a general-purpose monitoring framework applicable to a wide range of industrial processes. Using the Grid-connected PV System Faults (GPVS-Faults) dataset operating in intermediate power point tracking (IPPT) mode, KNM is evaluated in two fault scenarios, sensor faults and partial shading, against three benchmark techniques: OCSVM, iForest, and LOF. KNM achieves up to 99.1% and 98.3% accuracy on the two fault scenarios, respectively, using the Cauchy kernel, compared to 93.5% for the best-performing benchmark. The method is interpretable, and variable contribution plots are proposed to support fault identification.
0
0
stat.AP 2026-07-02

Parameter uncertainty reduces epidemic sensitivity and yields conservative policies

by Nicholas R. Wu, Michael C. Fu

Sensitivity Analysis and Optimization of Stochastic Epidemic Models under Parameter Uncertainty

Unbiased estimators for stochastic models show weaker herd-immunity effects and more cautious intervention levels when parameters are drawn

Figure from the paper full image
abstract click to expand
To address sensitivity analysis and optimization for a discrete-time stochastic epidemic model, we derive unbiased gradient estimators that accommodate uncertainties represented as distributions over the parameters of interest, such as those arising from Bayesian calibration. Specifically, we estimate the sensitivity of total infections over a finite time horizon with respect to the proportion immunized ($v$) and the contact rate ($\beta$). Comparing the proposed estimators with deterministic limit approximations based on large populations reveals differences due to the finite population and time horizon. The estimators exhibit lower variance than finite-difference estimators for the derivative with respect to $\beta$, but higher variance for the derivative with respect to $v$. Simulation experiments indicate parameter uncertainty reduces sensitivity to the parameters of interest. In particular, indirect effects of vaccination, such as herd immunity, are less pronounced compared to when parameters are known. For optimization problems balancing intervention and infection costs, incorporating parametric uncertainty leads to more conservative policies.
0
0
stat.AP 2026-07-02

20-50 sampled points per region lift spatial scan power

by Foad Namjoo, Drew McClelland +2 more

Sampling for Region-Aggregated Spatial Scan Statistics

Uniform sampling from each area's geometry and even value spreading recovers most detection ability lost by using centroids alone.

Figure from the paper full image
abstract click to expand
Anomaly detection in geospatial data is a crucial tool in geographic information science (GIS), with applications ranging from national security to public-health surveillance to the study of societal disparities. This work focuses on spatial scan statistics and addresses a key mismatch: spatial counts are typically aggregated into predefined regions (census tracts, zip codes, counties), whereas the most efficient scan algorithms operate on spatial point data. The standard remedy -- collapsing each region to its centroid, as in widely used tools such as SaTScan -- is convenient but, as we show, discards the region's spatial extent and causes a significant loss in statistical power. To resolve this, we propose a simple yet scalable fix: replace each spatial region with 20-50 points sampled uniformly from its geometry and spread the region's values evenly across them. This approach improves statistical power while maintaining computational tractability. A convergence analysis explains why so few samples per region suffice. We recommend this sampling-based conversion as the default way to apply point-based spatial scan statistics to region-aggregated data for anomaly detection.
0
0
stat.AP 2026-07-02

Bayesian model clusters Venice micro-mobility users into eight profiles

by Vanshika Keshwani, Stefano Mazzuco

Beyond the Flow: A Bayesian Latent Clustering Framework for Shared Micro-mobility Users in Venice

Users are grouped from raw trip sequences rather than summaries, separating localized, commuter, and tourist patterns.

Figure from the paper full image
abstract click to expand
The study on shared micro-mobility is based on trip modeling and user data. User segmentation in shared micromobility systems is traditionally studied by aggregating trip-level observations into user-specific summary measures before applying clustering techniques. Such aggregation can obscure trip-level variability and lead to ecological fallacies if results are interpreted as applying to individual records. We propose a Bayesian finite mixture model for multivariate categorical count data that clusters users directly from repeated trip-level observations while preserving the full categorical structure of individual travel behavior. This approach focuses on identifying heterogeneous mobility users from high-dimensional categorical trip behavior while accounting for uncertainty in cluster assignments. Users are the fundamental unit of analysis for exploring latent cluster patterns. The model represents each user with a product-multinomial likelihood with latent cluster membership. The methodology is illustrated using a one-year trip record of shared bikes and e-bikes from the Municipality of Venice, Italy, comprising over 220,000 trips made by more than 11,000 recurrent users. The analysis identifies eight distinct latent mobility profiles corresponding to localized, commuter-oriented, tourist-oriented, central, and inter-zonal travel behaviors. The proposed framework provides a flexible and computationally scalable approach for clustering repeated categorical observations and is readily applicable to other large-scale behavioral and transportation datasets.
0
0
stat.ME 2026-07-02

Latent achievement enters self-efficacy regression via conditional copula

by Sarah Lee, Matias Quiroz +1 more

How does academic performance affect self-efficacy? Interpretable modelling through latent academic achievement

Formulation yields interpretable link and faster variable selection than joint model in mixed-scale data

Figure from the paper full image
abstract click to expand
There is increasing evidence of a directional relationship from academic performance to self-efficacy. We develop a Bayesian model for investigating this relationship when academic performance is measured on an ordinal scale and self-efficacy on a continuous scale. The model allows latent academic achievement to enter the self-efficacy regression as a predictor, while Bayesian variable selection identifies factors associated with either response. The resulting conditional formulation yields an interpretable regression characterisation of how latent academic achievement relates to self-efficacy. Furthermore, it enables a tailored partially collapsed Gibbs sampler that analytically integrates out the regression coefficients when updating the variable inclusion indicators. Simulation studies demonstrate that the proposed conditional formulation and tailored sampler improve sampling efficiency and variable-selection performance relative to a recent, more general joint Gaussian copula regression formulation. We apply the methodology to data from the longitudinal study of Australian children, a landmark national cohort study covering children's education, social and emotional wellbeing, health and family circumstances. The model and analysis shed light on how latent academic achievement relates to self-efficacy in Australian children, and reveal that the two outcomes differ markedly in the range of covariates associated with each outcome.
0
0
stat.AP 2026-07-02

Reverse-martingale RNN matches forecast skill while warning of drought ahead of SPI-3

by Hui-Mean Foo, Yuan-chin Ivan Chang

Coupling Precipitation Forecasting and Early Warning with Reverse-Martingale Recurrent Neural Networks

The reconstruction defect from the backward-coherence penalty acts as a change detector that precedes the standard index in several climates

Figure from the paper full image
abstract click to expand
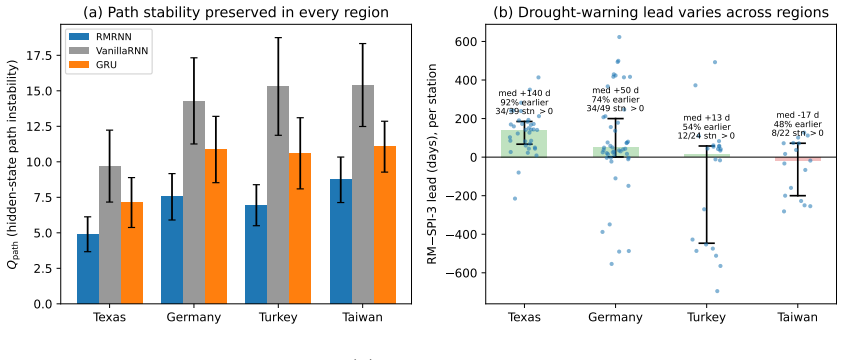
Precipitation forecasts are judged by accuracy, but the decisions they support -- when to restrict water, when to warn of drought -- turn on noticing when a local regime is becoming abnormal, which forecast scores alone do not reveal. We ask whether one recurrent model can do both with little or no loss in forecast skill. We add a backward-coherence (reverse-martingale) penalty that keeps the network's hidden state smooth when read backward in time; the size of the resulting reconstruction defect becomes an online warning signal, monitored by a sequential change-point detector. The design is deliberately conservative. On real daily station data from four contrasting climates -- monsoonal Taiwan, semi-arid Texas, temperate Germany, and Mediterranean Anatolia (Turkey) -- the model matches a standard network's forecast skill everywhere, and makes the hidden state markedly steadier in every region. The novelty is the added information: on these real droughts the signal can alarm well ahead of the operational SPI-3 index, giving lead that neither the forecast nor the index provides. This benefit is not uniform across the four regions -- large in one, partial in two others, and near-absent in the fourth. We offer the hydroclimatic character of drought onset, whether it precedes or merely coincides with the rainfall deficit, as a plausible explanation to be tested in future work, supported by a controlled synthetic study with known onset times. The contribution is thus a new and conservative way to read precipitation records: no loss in forecast skill, a steadier model, and an early-warning signal beyond the standard index.
0
0
stat.AP 2026-07-02

Economic variables predict suicide rates in western counties

by Noah Jackson, Sergey Lapin

Economic Disparities and Their Relationship to Destructive Health Behaviors in Five Western U.S. States

LASSO and correlation analysis on five-state data rank predictors and highlight key links to adverse health outcomes

Figure from the paper full image
abstract click to expand
In this paper, we look at the relationships that economic variables have with adverse health outcomes in the western counties of Washington, Idaho, Oregon, California, and Nevada, with specific emphasis on how suicide rate relates to such economic variables. Data was first gathered from Census and County Health Rankings for the entire United States (for website use and usefulness for future research), cleaned and regression-imputed, and then various exploratory data analysis methods were used, such as PCA, clustering, correlation gathering, linear fittings, and LASSO. PCA and clustering suggested that counties may group according to broader state-level economic patterns, although political interpretations would require additional electoral data. Correlation Analysis along with LASSO and linear fittings showed us the destructive variables that connected the most with economic variables (in terms of $R^2$ and correlation values seen), the economic variables that are most and least important in predicting suicide rate, and the possible relationships that suicide rate has with these economic variables.
0
0
cs.LG 2026-07-02

Causal models recover Airbnb guest price responses from booking data

by Yufei Wu, Daniel Schmierer

Understanding Guest Preferences and Optimizing Two-sided Marketplaces: Airbnb as an Example

Elasticity and heterogeneity estimates are used to optimize host pricing tools and guest recommendations.

Figure from the paper full image
abstract click to expand
Airbnb is a community based on connection and belonging -- many hosts on Airbnb are everyday people who share their worlds to provide guests with the feeling of connection and being at home; Airbnb strives to connect people and places. Among our efforts to connect guests and hosts, we provide tools to enable hosts to set competitive prices, which helps improve affordability for guests while helping hosts get more bookings. We also personalize the guest experience to show them the listings that match their needs. To help inform these efforts, we combine economic modeling and causal inference techniques to understand how guests book stays based on the prices hosts set, among other factors, and how that preference varies across different guests and listings. Such understanding helps us identify opportunities for Airbnb to support the marketplace and better connect guests and hosts. For example, understanding how much guests respond to different prices helps optimize the tools that we provide to hosts, in order to enable hosts to choose and set competitive prices that further balance demand and supply. As another example, understanding heterogeneity in guest preferences helps us personalize the guest experience and better match them with the listings that meet their needs, based on how much they respond to different prices and other factors.
0
0
stat.AP 2026-07-01

CTMC-Krylov and QBD recursions compute waiting times in dynamic-priority queues

by M. Abdullah Khokhar, Malgorzata M. O'Reilly +1 more

Waiting time analysis in a finite-capacity multi-server systems with dynamic priorities, dynamically evolving customer types, and abandonment

Finite multi-server systems with evolving customer types and abandonment admit both approximate and exact distribution analysis.

Figure from the paper full image
abstract click to expand
In many service systems, an estimation of customers' waiting times for the service can assist in decision making focused on enhancing the operational efficiency, improving the customers' experience, and ensuring efficient resource allocation. In this paper, we study the customers' waiting times in a finite-capacity service system with a finite number of parallel servers and a shared waiting area. We consider two customer types, Type 1 and Type 2, with dynamic admission priorities, dynamically evolving customer type, and abandonment. We model the system under such assumptions using a continuous-time Markov chain (CTMC) and develop a methodology based on Krylov subspace approximation methods to evaluate the conditional waiting time distributions of Type 1 and Type 2 customers in the system. This methodology (CTMC-Krylov) offers a scalable computational approach that is well suited for analysing large complex systems. Next, we model this system using a quasi-birth-and-death (QBD) process and derive analytical expressions building on matrix-analytic methods to evaluate the conditional and long-run waiting time distributions using recursion. We illustrate the practical applicability of our models in a hospital system through a suite of numerical examples based on a large dataset obtained from a tertiary referral hospital in Australia, considering two types of patients, complex (Type 1) and other (Type 2).
0
0
stat.ME 2026-07-01

Joint spatial model shrinks variances in ACS small-area estimates

by Zewei Kong, Paul A. Parker +1 more

Scalable Joint Modeling of Dependent Multi-Type Survey Data for Small Area Estimation

Shared random effects between binomial and Gaussian responses produce smaller posterior variances than separate univariate fits on income an

Figure from the paper full image
abstract click to expand
We develop a Bayesian area-level small area estimation framework that jointly models binomial and Gaussian survey responses through shared spatial random effects. This work is motivated by the American Community Survey (ACS), which provides useful information that contributes to federal funding and policy making decisions, and often yields direct estimates with large standard errors in small domains. The proposed Multi-type model borrows strength across outcomes and spatial neighbors to improve the precision of the associated estimates. For the binomial component, Polya-Gamma data augmentation yields a conditionally Gaussian representation, while spatial basis functions provide dimension reduction for high-dimensional spatial data. Together, these features lead to closed-form conditional posteriors and, thus, an efficient Gibbs sampler. Through empirical simulations, we show that the proposed joint model improves estimation precision relative to independent Univariate models. Applying the method to ACS median income and poverty rate data, we find that the proposed Multi-type model yields similar point estimates but smaller posterior variances than the corresponding Univariate models.
0
0
stat.AP 2026-07-01

Argo data produces OHC maps with correlated uncertainty

by Thea Sukianto, Mikael Kuusela +4 more

Locally stationary Argo ocean heat content estimates: Modeling, validation and uncertainty quantification

Locally stationary Gaussian process yields 2004-2022 anomaly fields and validated error ensembles from temperature profiles.

abstract click to expand
Argo profiling floats measure seawater temperature and salinity in the upper 2000 meters of the ocean. These floats are uniquely capable of measuring the global Ocean Heat Content (OHC), a quantity that is of central importance for understanding Earth Energy Imbalance. Yet, producing Argo-based OHC estimates with reliable uncertainties is statistically challenging due to the complex structure and large size of the Argo dataset. Here we present an end-to-end mapping and uncertainty quantification framework for Argo-based OHC estimation using state-of-the-art methods from spatio-temporal statistics. The framework is based on modeling vertically integrated Argo temperature profiles as a locally stationary Gaussian process defined over space and time. This enables us to produce computationally tractable OHC anomaly maps based on data-driven decorrelation scales estimated from the Argo observations. Our modeling choices are validated using statistical cross-validation, which demonstrates the importance of including a climatological time trend in the mean field and accounting for time in the covariance function. We quantify the uncertainty of these maps using local conditional simulation ensembles, a novel approach that leads to principled spatially and temporally correlated uncertainty quantification. A new paired cross-validation technique is presented to validate these uncertainties. The mapping framework is implemented in an open-source codebase that is designed to be modular, reproducible and extensible. To demonstrate the mapping and uncertainty quantification capabilities of this approach, we present new Argo OHC maps with uncertainties for 2004-2022 and report on various downstream climatological estimates and their uncertainties.
0
0
stat.AP 2026-07-01

Prior-informed model isolates T2D protein network changes

by Alessia Mapelli, Michela Carlotta Massi +3 more

Prior-informed conditional Gaussian graphical models: an application to protein interaction network reconstruction

Structured penalty blends database knowledge with covariate effects to flag 34 connectivity-only biomarkers and six pathway communities in U

Figure from the paper full image
abstract click to expand
Protein-protein interaction (PPI) networks, estimated from high-throughput omics data, foster biomarker discovery and precision medicine. Gaussian graphical models (GGMs) offer a principled reconstruction framework. Yet, existing applications face two limitations: they overlook the rich existing knowledge encoded in curated biological databases, and they assume a homogeneous network structure across all individuals, neglecting the influence of covariates or confounding factors on these interactions and preventing personalised representations. Even though these limitations have been addressed separately in previous work, no current approach resolves them simultaneously. We introduce a prior-informed conditional Gaussian graphical model that integrates database-derived interaction priors with covariate-dependent network modeling in a unified, scalable framework. The key methodological innovation is a structured, weighted penalty that selectively incorporates priors into population-level network estimation, while leaving context-specific perturbations entirely data-driven, as curated databases capture canonical interactions rather than disease-specific signals. Simulation studies demonstrate consistent and robust improvements in population-level network reconstruction across diverse settings, even when prior knowledge is imperfect. Applied to UK Biobank cardiometabolic proteomics (n = 49,129, p = 366 proteins), the method recovers T2D-associated network perturbations, identifying 34 network-central candidate biomarkers, several detectable only through their connectivity, not differential expression, and revealing six biologically coherent protein communities with distinct pathway enrichments spanning metabolic, cardiovascular, and cancer-related processes. Code is available at https://github.com/AlessiaMapelli/Prior-informed-conditional-GGMs.
0
0
stat.AP 2026-07-01

Bayesian model turns RCV poll counts into win probabilities

by Evan T. R. Rosenman, Jason Liang

Bayesian Uncertainty Quantification for Ranked Choice Voting Polls

A conjugacy relation lets the observed ballots update each candidate's chance of winning after all eliminations and transfers.

Figure from the paper full image
abstract click to expand
Ranked choice voting (RCV) is a popular alternative voting method in which voters are asked to list their favored candidates in preference order, rather than vote for a single candidate. When these ballots are tabulated, candidates are successively eliminated, and their votes are reallocated to each voter's next-preferred choice. The process continues until a candidate commands a majority of the active ballots and is declared the winner. As RCV gains wider adoption, the method poses novel challenges for pollsters. Unlike plurality elections, the event that a candidate wins cannot be expressed in terms of a single population parameter. Hence, the basic concept of a margin-of-error is not straightforward to define. Moreover, a candidate's ability to win may depend on both their support across the ballot and the order in which other candidates are eliminated. Existing measures of sampling uncertainty for polls of RCV elections do not clearly quantify these path-dependent outcomes. Here, we propose a simple, Bayesian framework to quantify uncertainty in polls of RCV elections. We cast the problem as one of estimating win probabilities for each leading candidate, and leverage a simple conjugacy relationship to estimate these probabilities conditional on the poll results. We include applied analyses involving two prominent ranked choice voting elections: the 2021 New York City Democratic mayoral primary, in which Eric Adams narrowly defeated Kathryn Garcia in the final round; and the 2022 special election to Alaska's U.S. House seat, in which Mary Peltola was elected despite not being a Condorcet winner. Using the cast vote records from both elections, we demonstrate some challenges of traditional frequentist uncertainty quantification in RCV polls. We also demonstrate the utility of our approach using a poll of the NYC primary obtained from the polling firm Data for Progress.
0
0
cs.LG 2026-07-01

Debiased ML with Bayesian priors estimates supply effects on bookings

by Yufei Wu, Daniel Schmierer +1 more

Estimating Supply Incrementality in Two-sided Marketplaces: A Causal Machine Learning Approach

The approach uses segment similarity features to produce plausible causal estimates of how extra listings change total marketplace transacti

Figure from the paper full image
abstract click to expand
In two-sided marketplaces with heterogeneous products, it is important to understand the causal relationship between additional supply and marketplace outcomes, such as the total quantity transacted or transaction value in the marketplace. This paper studies a causal machine learning approach to estimating this relationship across product segments. We use the Airbnb marketplace as an example, focusing on the impact of additional listing supply on total bookings, but the methodology applies to other two-sided marketplaces. Our approach combines double/debiased machine learning with a hierarchical Bayesian framework that leverages pre-existing knowledge as priors. We construct tractable and informative features for the model by leveraging measures of product segment similarity from the geospatial literature. We find that such a model provides plausible estimates of the marketplace returns to additional supply and strong out of sample performance.
0
0
stat.AP 2026-07-01

GP model adds terrain data for better wind power predictions

by Ahmadreza Chokhachian, V. Roshan Joseph +1 more

Spatio-Temporal Gaussian Process for Building Terrain-Incorporating Wind Power Curves

Aligning misaligned turbine data with a compact shared covariate set allows quantifying terrain effects on performance.

Figure from the paper full image
abstract click to expand
Accurate modeling of wind turbine power curves is crucial for optimal wind farm operation. Nearly all existing power curve models focus on temporal variables such as wind speed and temperature while overlooking the influence of terrain covariates, which governs inflow wind conditions and thus also affects wind power production. This paper proposes a nonparametric spatio-temporal Gaussian process model that integrates temporal environmental covariates with spatial terrain features. The model falls in the category of spatial-temporal Gaussian process models with data on a grid. The challenge to be addressed is that the spatio-temporal modeling require certain temporal alignment among the data, a property that the wind farm data does not have. Our solution strategy is to construct a shared representative temporal covariate set which not only aligns the temporal inputs but also has a size an order of magnitude smaller than the original data size. With this transformation, our resulting model is able to employ a separable kernel structure that captures both spatial and temporal dependencies. Empirical analysis on a real wind farm dataset shows that our method improves predictive accuracy over existing baselines and can be used to quantify the various impact of the terrain characteristics on turbine performance.
0
0
stat.ME 2026-07-01

Clustering on spend correlations separates marketing channel effects

by Yufei Wu, Zhiying Gu +3 more

Hierarchical Clustering As a Novel Solution to the Notorious Multicollinearity Problem in Observational Causal Inference

Normalizing and demeaning data before hierarchical clustering reduces collinearity enough for Bayesian models to identify individual impacts

Figure from the paper full image
abstract click to expand
Multicollinearity is a long lasting challenge in observational causal inference, especially in regressions -- highly correlated independent variables make it hard to isolate their individual impacts on outcomes of interest. While common solutions such as shrinkage estimators and principal component regressions are helpful in prediction problems, a crucial limitation hinders their applicability to causal inference problems -- they cannot provide the original causal relationships. To fill the gap, we present an innovative and intuitive solution, by employing hierarchical clustering to aggregate data in a way that effectively alleviates collinearity. This method is generally applicable to causal problems featuring multicollinearity. We use a marketing application to demonstrate how and why it works. Expenditures on different advertising channels often exhibit correlations, making it exceedingly difficult to separately measure their impact. Many previous studies proposed to leverage granular cross-sectional data for better identification but, to our knowledge, none explicitly addressed multicollinearity, which undermines causal identification even with granular data. We propose to hierarchically cluster geographic units based on marketing spend correlation to reduce collinearity, and to implement a Bayesian Marketing Mix Model with cluster-level data. Such clustering happens in two steps -- we first normalize and demean geo-level data to establish a common scale and to eliminate the common trends; we then calculate pairwise distance to summarize marketing spend correlation between geos and cluster the ones with moderate to strong correlation. Both descriptive evidence and regression analysis affirm that such hierarchical clustering effectively mitigates collinearity and facilitates the separate identification of the impact of different marketing channels.
0
0
stat.ME 2026-06-30

Residual-on-residual regression stabilizes causal estimates

by Ashley I. Naimi, Qianhui Jin +3 more

Residual-on-Residual Regression as a Tool for Effect Estimation in Observational Data

It remains unbiased and outperforms standard methods when positivity is weak and the effect is roughly constant after confounder adjustment.

Figure from the paper full image
abstract click to expand
Epidemiologists increasingly use machine learning to adjust for high-dimensional confounding. Augmented inverse probability weighting (AIPW) and targeted maximum likelihood estimation (TMLE) are most widely used but may yield different results and both can become unstable under weak positivity violations. Residual-on-residual regression is a stable alternative that estimates an exposure effect encoded in a partially linear model by fitting confounder adjusted models for the outcome and exposure, then regressing outcome residuals against exposure residuals using ordinary least squares. We illustrate the approach using data from the Nulliparous Pregnancy Outcomes Study: Monitoring Mothers-to-Be (nuMoM2b; $n = 7{,}923$), estimating the association between high vegetable intake density and preeclampsia. Residual-on-residual regression, AIPW, and TMLE yielded concordant estimates, indicating a modest reduction in preeclampsia risk. In simulations, residual-on-residual regression was unbiased with near-nominal confidence interval coverage, performing comparably to AIPW and TMLE and substantially better than a misspecified parametric model when the exposure effect is approximately constant. However, in simulation settings with positivity violations, residual on residual regression outperformed AIPW and TMLE when the true effect was coded in a partially linear model. When the exposure effect is approximately constant, residual-on-residual regression is interpretable, computationally simple, and provides a triangulation strategy for observational causal inference.
0
0
cs.LG 2026-06-30

Personalized thresholds lift job marketplace metrics while respecting guardrails

by Yufei Wu, Zhen Yan

Personalizing Marketplace Policies with Competing Objectives and Constrained Experiments: Evidence from a Job Marketplace

Framework uses hybrid models and monotonicity extrapolation to personalize free-value policies under limited cluster experiments.

Figure from the paper full image
abstract click to expand
Two-sided marketplaces connect distinct user groups whose interests often conflict -- improving outcomes on one side could degrade the other side's experience. To address this challenge, we deploy an integrated framework for personalizing free-value thresholds -- a policy governing the scope of complimentary services for job listings -- across a two-sided job marketplace connecting millions of employers and job seekers. Our personalized policy delivers statistically significant and economically sizable lift in the target metric while respecting engagement guardrail constraints. Direct application of standard uplift methods proves insufficient here for two reasons. First, cross-side externalities demand multi-objective optimization: maximizing employer-side metrics risks harming job seeker engagement, with effects varying substantially across job segments. Second, marketplace interference necessitates cluster-level randomization, limiting us to few discrete treatment levels -- effectively a form of positivity violation that rules out methods designed for continuous treatments. We contribute an integrated framework with three components. Our ensemble-based hybrid ranking models target and guardrail metrics separately, cutting guardrail risk by over 10% for equivalent target gains compared to single-objective approaches. A treatment effect extrapolation method extends our estimates from limited experimental variation to untested policy levels, relying on monotonicity assumptions that we validate empirically. Finally, we present production deployment, where post-launch data confirms both extrapolation accuracy and guardrail compliance. Our deployed system demonstrates that principled methodology can enable meaningful personalization even when experiments are severely constrained and different objectives compete -- common conditions that characterize many real-world marketplaces.
0
0
stat.ME 2026-06-30

Cluster-level cross-fitting fixes coverage in survey TMLE

by M. Ehsan Karim

Cross-Fitted Survey-Weighted TMLE with Design-Based Variance for Causal Machine Learning

Single-fit versions cover at 0.85-0.91 while out-of-fold cluster fitting holds 0.93-0.95 once learners are flexible.

Figure from the paper full image
abstract click to expand
Cross-fitting is not a refinement of survey-weighted causal machine learning but, once the nuisances are flexible, what restores valid inference. We study the population average treatment effect under a stratified multistage design, estimated by a survey-aware targeted maximum likelihood estimator (TMLE) whose variance is obtained by Taylor-series linearization of the influence function, treating the primary sampling unit as the replication unit. Our central result, established in theory and simulation, is that this validity turns on cross-fitting at the cluster level. Once flexible learners cross a complexity (Donsker) boundary, single-fit survey TMLE can severely under-cover, and internal cluster-aware cross-validation does not substitute for cross-fitting; among the estimators we evaluate, only out-of-fold fitting at the cluster level restores valid coverage. In simulations spanning a many-PSU and an NHANES-like design, on a diverse ensemble the single-fit and internal cross-validation estimators cover at about 0.89-0.91 and 0.85-0.88 while the cross-fitted estimator holds at 0.93-0.95, and an aggressively grown learner drives single-fit coverage to 0.22. Two scope choices are deliberate: survey-weighted point estimation is prior work, and the nuisance product-rate condition is assumed and probed empirically. Within these conditions we prove asymptotic normality and design-consistency of the linearization variance. Four NHANES analyses and open-source software illustrate the method.
0
0
stat.ML 2026-06-30

Neural network forecasts next alternating event time

by Abigail Loe, Susan Murry +1 more

Dynamic Prediction of Alternating Recurrent Events via Neural Network

Inverse probability weighted pseudo-observations let the model handle censoring and dependence when predicting event-free intervals.

abstract click to expand
Alternating recurrent events -- event-times of a specific nature that trigger a secondary refractory period -- occur in a wide-range of fields, including behavioral science, criminal justice, and biostatistics. Analysis of these events requires careful attention to the statistical nuance, including correlated observations and repeated outcomes subject to potential censoring. We develop an online dynamic prediction framework appropriate for predicting subsequent alternating recurrent events, by developing neural network theory for a statistical audiences and applying inverse probability weighted pseudo-observations. The proposed model is applied to dynamically predict alternating recurrent event-free time, showing good performance in simulation, and outstanding capability in application to predicting periods of low mood for first-year medical residents. We close with a discussion.
0
0
stat.AP 2026-06-30

Error models outperform lag models for census non-response prediction

by Emanuel Ben-David

Spatial Dependence in the Self-Response: Spatial Dependence, Modeling, and Operational Consequences

Spatial-block validation favors SEM and SDEM while the in-sample best SDM generalizes worst.

Figure from the paper full image
abstract click to expand
The U.S.\ Census Bureau's Low Response Score (LRS) is a central planning instrument for identifying places likely to require additional self-response outreach and nonresponse follow-up. The published LRS is intentionally interpretable: it is built from tract-level covariates using an ordinary least squares specification. That transparency, however, leaves open an important question for official statistics: how much spatial structure remains after the own-tract covariates have done their work, and what form does that structure take? Using the observed 2010 Census mail non-return rate for 71,076 U.S. census tracts and the twenty-five Erdman--Bates LRS predictors, this paper compares the full spatial autoregressive model family under queen-contiguity weights and validates the leading candidates with both random and spatial-block cross-validation. OLS leaves strong residual spatial autocorrelation ($I=0.399$). Formal diagnostics and model comparisons indicate that the remaining dependence is primarily error-type rather than a global endogenous lag process. Although the spatial Durbin model minimizes in-sample AIC, spatial-block validation reverses that ranking: the error-family models (SEM/SDEM) generalize best, while the AIC-best SDM is weakest out of sample. The SDEM provides an interpretable middle ground, absorbing residual spatial dependence while representing neighborhood demographic effects as local spillovers. Robustness checks show that these conclusions are invariant to the weights definition and are not an artifact of tract-size-driven heteroskedasticity. The results suggest that LRS-style response models should be evaluated with spatial validation, not only in-sample fit, and that local neighborhood context can be operationally meaningful without invoking a global response-contagion mechanism.
0
0
stat.ME 2026-06-30

Conditional test unifies HWE check and SNP association in GWAS

by Stefan BΓΆhringer, Hajo Holzmann

Evaluating HWE and Association in Genome Wide Association Studies: A Unified Procedure

The procedure improves power and SNP ranking by folding equilibrium information directly into association p-values.

Figure from the paper full image
abstract click to expand
In genome wide association studies (GWASs) based on a case-control design, single nucleotide polymorphisms (SNPs) are typically evaluated for an association test and a Hardy-Weinberg equilibrium (HWE) goodness-of-fit test. SNPs are then excluded from analysis based on a HWE cutoff to avoid false positives. In order to avoid cutoffs based on arbitrary threshold values, we propose a conditional genotype--based test that conditions the Pearson $\chi^2$-statistic in the 3x2 contingency table on the $\chi^2$-statistic for HWE in the control group, and develop the relevant asymptotic distribution theory. We show by simulations that our test in most scenarios is more powerful than two competing retrospective procedures. Another important advantage of the proposed method is a better ranking of SNPs in GWASs as HWE is accounted for in computing p-values of SNP association. We demonstrate this effect on a data set in an alopecia study. In conclusion, our test makes separate HWE testing superfluous by providing a unified framework and strictly improves on the standard procedure in terms of power and interpretability, thereby making replication more cost effective and improving subsequent fine mapping.\par
0
0
stat.ME 2026-06-30

Ordinal time series model estimates category spacings from data

by Anna Nalpantidi, Dimitris Karlis +1 more

Beyond Equidistant Assumptions: An Autoregressive Ordered Stereotype Model for Ordinal Time Series

The AR-OSM adds lagged responses to capture serial dependence while letting the data set distances between categories instead of assuming th

Figure from the paper full image
abstract click to expand
We propose an extension of the ordered stereotype model (OSM) for ordinal time series data, referred to as the Autoregressive OSM (AR-OSM). The model captures serial dependence by incorporating lagged values of the response as covariates in the systematic component. In contrast to existing regression models for ordinal time series, the AR-OSM does not assume equidistant categories, but instead allows the data to determine their relative spacing. This property makes the model particularly suitable for applications where the equidistance assumption is unrealistic. Such a case is illustrated through the analysis of infant sleep state data. Additionally, a comprehensive simulation study is conducted to assess the performance of the model under varying sample sizes and to investigate how parameter values influence the induced serial dependence structure.
0
0
cs.CR 2026-06-30

Exact privacy math for 2020 Census now 1824 times faster

by Buxin Su, Weijie Su +1 more

A Sieve-Accelerated Quadrature Method for Exact Privacy Accounting in the 2020 U.S. Decennial Census

Sieve-accelerated quadrature evaluates high-dimensional noise convolutions to 10^{-35} precision without assumptions, allowing minimal noise

Figure from the paper full image
abstract click to expand
In 2020, the U.S. Census Bureau adopted differential privacy for the Decennial Census by injecting integer-valued Gaussian noise into published census tabulations. Exactly evaluating the privacy guarantees of these data releases would enable the Bureau to determine the absolute minimum noise required to satisfy a given privacy budget, preventing the injection of unnecessary excess noise and thereby substantially enhancing the statistical utility of the data for downstream applications such as federal funding allocation and political redistricting. In this paper, we introduce a computationally efficient and mathematically rigorous quadrature method to evaluate the exact privacy profile of practical, large-scale census releases under the composition of heterogeneous discrete Gaussian mechanisms. Mathematically, this problem reduces to evaluating the tail probabilities of high-dimensional convolutions of integer-valued random variables sampled from heterogeneous discrete Gaussian distributions under exceptionally stringent numerical error tolerances (e.g., $10^{-35}$). By recasting the exact privacy accounting as a numerical integration problem via the discrete Fourier transform, we explicitly exploit the exponential convergence of the trapezoidal rule for complex analytic, periodic characteristic functions. Furthermore, to overcome the computational bottleneck of evaluating highly oscillatory integrands in high dimensions, we develop a sieve algorithm that identifies and prunes negligible quadrature nodes, accelerating the computation by three orders of magnitude. Taken together, these numerical innovations enable the first exact, assumption-free privacy accounting for the 2020 Census Demographic and Housing Characteristics File, achieving a 1,824-fold speedup over prior methods while maintaining census-mandated error tolerances.
0
0
stat.AP 2026-06-30

Statistics students should probe LLMs as stochastic systems

by Tian Zheng

Probing the Stochastic Machine: Engaging with LLMs in Statistics Curricula Through Veridical Data Science

Small experiments on output variability and prompt effects teach core skills for analyzing bias and distributions.

abstract click to expand
Large language models (LLMs) are interactive stochastic systems whose most consequential behaviors are still only partially understood. This discussion argues that statistics curricula should treat LLMs not only as tools, but as objects of inquiry: students can probe variability, bias, and prompt sensitivity by designing small experiments and analyzing distributions of outputs. Building on the Veridical Data Science framework and Predictability-Computability-Stability (PCS) principles, this discussion outlines how to organize critical LLM engagement across educational levels and propose four curricular examples, from introductory ``ask it twice'' activities to graduate PCS stability audits of LLM-based analysis workflows.
0
0
stat.ME 2026-06-29

Bayesian model segments satellite images without local labels

by Bao Khanh Nguyen, Iain Cameron +2 more

Scalable Bayesian Spatial Mixture Modelling for Remote Sensing Image Segmentation

POTTERS extends the Potts model with external priors and variational inference for scalable segmentation and uncertainty in new regions.

Figure from the paper full image
abstract click to expand
Accurate and scalable land cover classification is essential for global conservation monitoring and policy-making. While remote sensing images provide a cost-effective alternative to ground surveys, current methods often lack principled uncertainty quantification and require substantial labelled data, limiting their usability and reliability in new regions with distribution shifts. We propose a Bayesian spatial mixture modelling approach for image segmentation, extending the classical Potts model by allowing for a generalised spatial dependence structure and incorporating informative priors estimated from pre-existing labelled data. Our framework, called POTTERS (Potts Model for Enhanced Remote Sensing), enables robust uncertainty quantification, accounts for class interactions, and can detect new clusters in the target region of interest. Crucially, our model does not require labelled data from the target region; instead, it incorporates prior information about the labels from pre-existing externally labelled images. To ensure scalability to large remote sensing images, we develop an efficient variational inference algorithm for posterior approximation. We demonstrate the benefits of our approach in simulation studies and apply it to land cover classification in a case study in Scotland, leveraging publicly available remote sensing data from England.
0
0
stat.AP 2026-06-29

Bayesian CDD alone stays accurate on gene directions across all DREAM5 networks

by Xiaoying Wei, Clara Grazian

Bayesian Copula Directional Dependence is Cross-Network Robust for Gene-Regulatory Pair Direction: A Benchmark Study on DREAM5

Only method above 60% accuracy, 88% coverage and 0.6 AUROC on synthetic, S. aureus and E. coli benchmarks; rivals fall to chance on at least

Figure from the paper full image
abstract click to expand
Inferring the direction of a gene-regulatory relationship is harder than inferring whether a relationship exists, and most direction-inference methods are validated mainly on a single in silico benchmark. We ask which method remains reliable as the data move from a synthetic network to real organisms and as sample size decreases. We embed a copula-based measure of directional dependence (CDD) in a Bayesian framework that returns, for each candidate pair, a posterior distribution over a directional contrast, a 95% credible interval, a posterior sign-support score, and a principled no-call. We benchmark this estimator against eight direction-inference methods, including two Bayesian DAG-posterior baselines, on the three core DREAM5 networks (in silico, S. aureus, and E. coli), with S. cerevisiae used as an out-of-domain eukaryotic stress test. Across the three core networks, Bayesian CDD is the only method whose called accuracy is always above 60%, whose coverage is always above 88%, and whose direction AUROC is always above 0.6; every competing method falls to chance or below on at least one network. CDD ranks first on both real-organism networks, remains stable on the smallest-sample network where bootstrap-interval methods collapse, and is the only Bayesian method that is simultaneously above chance and high-coverage under a 95% posterior gate. We position CDD as a post-screening, uncertainty-aware direction-refinement tool for candidate regulatory pairs.
0
0
stat.AP 2026-06-29

Data on 37 nurses disproves modeling assumption in roster analysis

by Richard D. Gill

Critique of "Use of roster charts in the investigation and prosecution of nurses ..." by John O' Quigley

Errors in statistical work show the roster chart data contradicts the key hypothesis used for nurse harm investigations.

Figure from the paper full image
abstract click to expand
The paper "Use of roster charts in the investigation and prosecution of nurses suspected of inflicting deliberate harm on patients" by Prof. John O'Quigley explores an interesting hypothesis concerning statistical information hidden in the part of the infamous Lucy Letby roster chart pertaining to the 37 other nurses. Unfortunately, we have to point out some serious errors in his statistical analyses. The data actually contains information which strongly disproves his main modelling assumption. We do, however, strongly agree with him that from a forensic statistical point of view, the roster chart is fake evidence which should not have been shown to jurors.
0
0
stat.AP 2026-06-29

Language model embeddings beat hand-crafted features in car insurance pricing

by Christopher Blier-Wong, Derek Kusmenko

Semantic insurance pricing with large language models

Embeddings from policy descriptions improve Poisson regression especially with small datasets, but require controlled prompts for governance

Figure from the paper full image
abstract click to expand
Classical actuarial pricing models, such as the generalized linear model, are valued for transparency and ease of governance, but they use interactions among risk factors only when these are supplied through explicit feature engineering. We study whether embeddings from a pre-trained large language model, computed from a natural-language description of each policyholder, can replace hand-crafted features as inputs to a standard actuarial pricing model, taking Poisson claim-frequency regression as the main example. The language model is used only to construct deterministic embedding covariates; pricing is performed by a standard generalized linear model. Using French motor third-party liability data, the embedding-based model outperforms the generalized linear model, especially when data are scarce, whereas at larger sample sizes the comparison is model- and dimension-dependent. Insurance-specific fine-tuning further improves the embeddings, and a prompt-sensitivity diagnostic shows that the pipeline reacts to any appended out-of-template field, making controlled prompts a governance requirement.
0
0
cs.AI 2026-06-29

Specialized clinical AI beats general models by 25-39 points on real questions

by Jean Feng, Vishal Patel +6 more

Expert Evaluation of Clinical AI Tools on Real Point-of-Care Clinical Queries

Blinded specialist physicians preferred the targeted tool on accuracy, utility, sources, verifiability and completeness across 620 actual po

abstract click to expand
Physicians now pose millions of clinical questions to AI tools each week, yet these tools are evaluated largely on hypothetical or exam-style questions, not those actually asked in practice. We report a blinded evaluation built on 620 Real-world Point-Of-Care Queries (Real-POCQi) submitted to the OpenEvidence (OE) platform by physicians spanning 30 specialties, as well as 187 questions from HealthBench. 149 practicing physicians across 36 states made head-to-head comparisons between answers from three frontier general-purpose models (Claude Opus 4.8, Gemini 3.1 Pro, and GPT-5.5) and a specialized clinical tool (OE), with graders matched to each question's specialty. When comparing answers along five dimensions relevant to clinical decision support -- accuracy, clinical utility, source quality, verifiability, & completeness -- physicians scored the specialized tool highest on all axes; in the primary analysis on Real-POCQi, win differences (margins between win and loss rates) ranged from 25 to 39 percentage points (p<0.001). Results remained consistent in sensitivity analyses stratifying by citation display, answer length, OE-user status, and Real-POCQi versus HealthBench. In parallel, LLM judges were found to systematically differ from expert judges, though both generally agreed on the best model. These findings underscore two conclusions: (i) AI tool evaluations should reflect real-world query distributions and use expert judges that mirror the specialization defining modern medicine and (ii) the consistent advantage of the specialized tool over general-purpose models does not necessarily mean that the latter cannot serve similar purposes, but that targeted engineering and customization can yield meaningful gains in performance for its users. We release Real-POCQi as a public benchmark, as well as the prespecified statistical analysis for reproducing results of this study.
0
0
stat.AP 2026-06-29

Methods correct errors in both outcomes and covariates

by Pamela A. Shaw, Bryan E. Shepherd

Methods to address measurement error in both Outcome and Covariates

Tutorial reviews approaches for routine biomedical data and supplies code to compare them directly.

abstract click to expand
Biomedical research is increasingly relying on readily available routine data, such as electronic health records. Routinely collected data, as well as datasets from large cohorts, are often prone to measurement error which, if not addressed in analyses, can bias study results and ultimately mislead clinical decision-making and potentially harm patients. For this setting, methods that address errors in the outcome and multiple covariates are needed. In this tutorial, we will review available methods to address for errors in both outcomes and covariates. We will illustrate methods with use of a running example in order to compare the methods directly. Both the data and analytic code are provided for the user so that they may easily reproduce results in each example. We conclude the tutorial with a discussion of the different approaches and highlight areas of future work needed for this setting.
0
0
cs.AI 2026-06-29

LLM probe unifies EHR modalities for 87.69% ICD accuracy

by Chengyuan Liu, Xinyue Zhang +2 more

Primary ICD Category Prediction using LLM-based Probing

Frozen medical model representations combine structured variables and notes to beat single-modality baselines, with a 2M-parameter adapter e

abstract click to expand
Objective: ICD codes are central to reimbursement, research, and population health surveillance, yet automated coding systems often struggle to integrate diagnostic signals from both clinical narratives and structured electronic health record (EHR) variables. We evaluated whether frozen medical large language model (LLM) representations can serve as a shared embedding space for multimodal primary diagnosis category prediction. Materials and Methods: We constructed a MIMIC-IV cohort of 13,645 admissions from the 10 most frequent primary ICD-10 codes, consolidated into seven categories. Structured variables were serialized into clinical narratives and combined with leakage-pruned discharge notes. Using a frozen MedFound-Llama3-8B-finetuned backbone, we extracted hidden states from five transformer layers and trained linear probes for structured-only, unstructured-only, and combined inputs, comparing against XGBoost and information-matched PLM-ICD baselines and evaluating MIMIC-III adaptation with a compact bottleneck adapter. Results: The combined probe performed best on MIMIC-IV (87.69% strict; 91.45% medical accuracy), exceeding both single-modality probes and baselines. The structured-only probe outperformed its standard baseline by 6.19 points in medical accuracy. Diagnostic information became increasingly linearly separable in deeper layers, and a 2M-parameter adapter restored cross-dataset transfer to MIMIC-III using only 5% of target labels. Discussion: LLM embeddings can unify structured and narrative EHR information for multimodal diagnosis prediction, supporting efficient reuse of clinical representations across modalities and datasets through a small representation-level module. Conclusion: Multimodal probing of frozen medical LLM representations provides a practical approach for studying EHR modalities and adapting clinical representations across datasets.
0
0
stat.AP 2026-06-29

Imputation ensembles form stable connected structures not random clouds

by Arturo Tozzi

Topological reconstruction of Rubin multiple imputation via coarse proximity, Seifert van Kampen gluing and Hurewicz invariants

Coarse-proximity graphs of biomedical cohorts show connectivity persists locally but shifts when missingness rises and accuracy falls

Figure from the paper full image
abstract click to expand
Rubin multiple imputation (MI) generates plausible data completions to account for uncertainty and statistical variability but provides little insight into their global organization. We introduce a topological reconstruction approach that complements MI by examining the ensemble of completed datasets. Individual imputations are represented as points in a reconstruction space whose coordinates summarize statistical properties. Concepts from coarse geometry and algebraic topology are then used to characterize relationships among alternative imputations across multiple scales. Coarse proximity (CP) defines large-scale neighborhoods, generating graphs in which nodes represent completed datasets and edges connect sufficiently similar imputations. Seifert van Kampen gluing provides a conceptual interpretation of how local reconstructions assemble into globally coherent structures, whereas Hurewicz-type invariants quantify persistent connectivity patterns. Synthetic multivariate biomedical datasets representing adult cardiometabolic cohorts were generated with controlled missingness levels. Multiple stochastic imputations were projected into the reconstruction space and analyzed through CP graphs, connected components, cycle descriptors and scale-dependent topological measures. MI generated structured spaces with distinct connectivity patterns rather than homogeneous clouds of solutions. Topological descriptors remained stable despite local numerical variability, whereas increasing missingness produced transitions in reconstruction-space connectivity together with progressive deterioration of reconstruction accuracy. Our approach could be applied to biological and social networks, systems medicine, ecological modeling and other domains in which large-scale structural organization contributes to reliable inference.
0
0
stat.ME 2026-06-29

Ray-based model scales projected Gaussians to high-dimensional compositional data

by Michael R Schwob, Jyotishka Datta

Composition as Direction: An Active-Set Ray-Based Model for Sparse High-Dimensional Compositional Data

The ARC framework maps compositions to hypersphere directions, separates active components from positive subcompositions, and keeps computat

Figure from the paper full image
abstract click to expand
[Working Draft] Compositional data are central to microbial, ecological, and environmental research, yet often have four features that are difficult to accommodate jointly: exact zeros, latent dependence among components, high-dimensionality, and a unit-sum constraint that induces a non-Euclidean geometry. Conventional Dirichlet-type and logistic-normal models address these features only partially. Projected Gaussian models offer a directional representation that captures exact zeros and latent dependence; however, support correctness on the simplex requires either truncation or folding, both of which become computationally prohibitive as the dimension grows. We develop an Active-set Ray-based Compositional (ARC) framework, which retains the benefits of projected Gaussian models while remaining computationally feasible in high-dimensional settings. In this framework, we map compositions to the nonnegative orthant of the unit hypersphere and specify an active-set process that governs which components are present. Conditional on the active set, the positive subcomposition is modeled by evaluating a latent Gaussian density along positive rays of the active subspace with the radius treated as an auxiliary variable. Such a construction (i) separates the active-set process that governs which components are present from the positive subcomposition on the active components, (ii) preserves a latent Gaussian interpretation, and (iii) accommodates arbitrary latent dependence. Thus, the framework is conducive to high-dimensional applications in which exact zeros and shared positive responses are scientifically central. Conceptually, the proposed framework reframes a composition as an observed direction of a latent abundance vector with an unobserved magnitude and an explicitly modeled active set.
0
0
cs.AI 2026-06-29

Nine LLM families show 90.3% consistent virtue rankings

by Ioannis Tzachristas, John Pavlopoulos

Aristotelian Virtue Profiling of LLMs through Ethical Dilemmas

VirtueMap scores models on courage, temperance and justice by ranking dilemma responses against human-confirmed orderings.

Figure from the paper full image
abstract click to expand
Large Language Models (LLMs) often face ethical tradeoffs in which several responses may be defensible but express different priorities, such as fairness, honesty, courage, or restraint. We introduce VirtueMap, a framework for describing these patterns through an Aristotelian virtue-ethics lens. Instead of asking for a single correct answer, VirtueMap asks humans or LLMs to rank all five responses to each of seven general, non-lethal, non-political, and non-religious ethical dilemmas. To define the reference orderings used for scoring, we first proposed, for each dilemma and virtue, an ordering of the five responses from most to least expressive of that virtue. We then collected more than 100 respondent evaluations per ordering and retained it as operational ground truth only when at least 95% confirmed it. Rankings are scored against these retained orderings using normalized Borda alignment, yielding profiles over Practical Wisdom, Justice, Truthfulness, Courage, and Temperance. We apply VirtueMap to nine LLM families in a repeated-run evaluation and find high mean rank consistency (90.3%), with the largest differences appearing on Courage, Temperance, and Justice. We also release an interactive website that computes profiles locally in the browser and compares respondents with measured LLM profiles.
0
0
stat.AP 2026-06-29

Bayesian estimation spreads Hurst uncertainty into option prices

by Hana H. Sagor, Edward L. Boone +1 more

Bayesian Joint Estimation of the Hurst Parameter and Volatility with Applications to Fractional Option Pricing

Joint posterior inference on long-memory and scale parameters yields ranges of option prices rather than point estimates in fractional model

Figure from the paper full image
abstract click to expand
Fractional Brownian motion has been widely used in financial modeling to capture long-range dependence and persistent behavior observed in asset dynamics. In the fractional Black--Scholes framework, accurate estimation of the Hurst parameter is essential, since estimation uncertainty can directly affect option pricing results. In this paper, we propose a Bayesian framework for joint inference on the Hurst parameter and volatility in fractional stochastic differential equation models. In contrast to approaches based solely on point estimation, the proposed method propagates posterior uncertainty directly into option pricing distributions under the fractional Black--Scholes model. Simulation studies are conducted across multiple values of the Hurst parameter and sample sizes to evaluate estimation accuracy, posterior coverage, and pricing uncertainty. The results demonstrate stable posterior inference and coherent uncertainty quantification for both model parameters and option prices. The methodology is further illustrated using WTI crude oil and natural gas data under different market regimes. The empirical analysis indicates that differences in market behavior are driven primarily by changes in volatility rather than strong long-range dependence, while posterior option price distributions reflect substantial variation in pricing uncertainty across regimes. These findings highlight the importance of incorporating joint parameter uncertainty in fractional financial models and demonstrate the practical value of Bayesian methods for option pricing applications.
0
0
q-bio.QM 2026-06-29

Habitual timing explains circadian peaks

by Billy C. Smith, Zeel Pansara +12 more

Habitual lifestyle timing explains circadian timing, but daily lifestyle changes do not, in free-living humans across 2000 days

In 2000 days of real-life data, stable habits accounted for 42 percent of timing variance while day-to-day shifts accounted for under 1 perc

Figure from the paper full image
abstract click to expand
Background: Both between- and within-subject variations in circadian timing matter for health. If lifestyle changes could be used to regulate circadian timing, they would offer accessible and scalable routes to chronotherapy, but this link remains unclear under real-life conditions. Here, we explore how lifestyle 'traits' (such as typical wake time) and 'states' (day-to-day deviations from traits, such as waking up later than typical) explain between- and within-subject variation in acrophase (peak time) of the circadian rhythm of heart rate (CRHR). Methods: We collected free-living wearable data (smartwatch, continuous glucose monitor) from healthy volunteers for up to 4 weeks. The CRHR was derived from activity-adjusted heart rate, and acrophase was defined as time-of-day at daily CRHR peak. Sleep, food, and physical activity 'factors' were calculated and split into traits and states. Using a linear mixed-effects model, we tested how traits and states associate with between- and within-subject acrophase variance. Findings: Data from 105 healthy volunteers (66 female, age = 42.5 $\pm$ 15.7 years) spanning ~2000 days (18.8 $\pm$ 8.30 days each) were analysed. Traits were substantially more influential than states, explaining 42.3% versus 0.9% of total acrophase variance. Accordingly, traits explained 86.5% of between-subject variance, whereas states explained only 1.8% of within-subject variance. Sleep, food and physical activity factors contributed both jointly and uniquely, and lifestyle timing mattered most. Interpretation: Between-subject lifestyle traits explained acrophase better than within-subject lifestyle states. This asymmetry, alongside the considerable overlap between factors, supports sustained, holistic, timing-focused lifestyle adjustments as chronotherapy targets, testable through future interventional studies.
0
0
stat.AP 2026-06-29

Push puppet networks resize LLMs to any size after one training run

by Robert Kubinec

Push Puppet Networks: Structured Bayesian Pruning Algorithm for Language Model Compression

A hierarchical penalty function learns gating parameters that select layers for arbitrary compression levels without reloading the full mode

abstract click to expand
This paper presents push puppet networks, a novel Bayesian algorithm for structured pruning of large language models. The push puppet network learns a hierarchical function during training that can optimally determine specific network layers to keep for a given target size. By adding a small number of gating parameters via a hierarchical penalty function, the learned smooth function can allow for a network to be resized to very specific sizes without loading the full model into memory or requiring further post-training computation. The method compares favorably with existing approaches (SparseGPT, Wanda) at high pruning sizes (less than 50% of network structure) while realizing measurable speed-ups on conventional GPUs with PyTorch. Furthermore, push puppet networks can achieve significant speedups as candidates for speculative decoding.
0
0
eess.SY 2026-06-29

Motion cueing variants show no difference in 5.4% acceleration JND

by Erik Gustaf LilljebjΓΆrn, Sogol Kharrazi +2 more

Effects of motion cueing on longitudinal acceleration perception in a driving simulator

Simulator tests find equivalent perception thresholds for tuned and general algorithms in launch maneuvers

Figure from the paper full image
abstract click to expand
The driveability of a new heavy-truck driveline is traditionally assessed using physical prototypes. Enabling early evaluation of the driving experience in a human-in-the-loop driving simulator using a virtual prototype has the potential to significantly improve development efficiency. To enable driveability assessment using a moving-base simulator, participants must be able to perceive small differences in longitudinal acceleration. The just-noticeable difference (JND) was therefore evaluated for two variants of the classical motion-cueing algorithm (MCA) tuned specifically for tip-in/launch tests and compared to a more general variant in a driving simulator with a long linear track. Psychometric functions were fitted to responses obtained using a weighted staircase procedure and analysed using a generalized linear model. No significant differences in JND were found between the motion cueing variants. The mean JND across all participants and MCA variants was 5.4%. The mean point of subjective equality in the JND experiment was -1.9%, suggesting that participants perceived the acceleration as higher in the second stimulus of a pair. In a subjective comparison, most participants preferred the motion cueing variants that were tuned for launch manoeuvres over the general variant.
0
0
cs.CR 2026-06-29

AI agents re-identify 72% of mobility traces from public sources

by Oscar Thees, Roman MΓΌller +1 more

Agentic AI-Powered Re-Identification: An Emerging, Scalable Threat to Mobility Microdata Privacy

Autonomous LLM pipeline matches location sequences to identities using web searches alone, shifting assumptions in statistical disclosure co

Figure from the paper full image
abstract click to expand
The widespread collection of fine-grained location data by commercial data brokers creates a re-identification risk that is not widely recognised by the public. While prior research has established that mobility traces are highly unique and that individuals can, in principle, be identified from a handful of spatio-temporal points, such attacks have historically required significant manual effort from skilled analysts, limiting their practical scale. In this feasibility study, we demonstrate in a real world setting that agentic AI fundamentally changes this threat model. We present an end-to-end pipeline in which large language model agents autonomously search the open web, cross-reference public records and social media, and resolve raw coordinate sequences to candidate identities - without human intervention. We evaluate the pipeline on a spatio-temporal dataset containing simulated location points anchored at and around true home and work addresses, focusing on a high-risk disclosure scenario. Our results demonstrate that, from spatio-temporal data and public sources alone, our agentic AI successfully re-identified 18 of the 25 re-identifiable individuals (72%) and 18 of 43 cases overall (41.9%). We discuss implications for Statistical Disclosure Control (SDC) practice and outline the near-future escalation that data custodians and regulators must anticipate. De facto anonymity - an implicit foundation of SDC practice - is shifting. Agentic AI strengthens the case that re-identification is reasonably likely by any means under the GDPR Recital-26 standard, at costs of minutes-and-dollars per target.
0
0
cs.IR 2026-06-29

Off-the-shelf LLMs hit 70% top-10 journal recommendation accuracy

by Yanglin Yan, Zicheng Xie +3 more

An LLM-Powered Semantic Alignment Framework for Journal Recommendation

Semantic matching of article content to journal scopes works without training data or historical records on a 23k-article statistics dataset

Figure from the paper full image
abstract click to expand
Journal recommendation is an important task in scholarly information systems. Existing approaches typically rely on supervised learning models, manually engineered features, or historical interaction data, which may limit their generalizability and interpretability. We propose an LLM-powered semantic alignment framework that formulates journal recommendation as a semantic matching problem between manuscript content and journal scope descriptions. The framework enables large language models (LLMs) to infer journal suitability directly from article titles, abstracts, keywords, and candidate journal information without task-specific training. Experiments are conducted using DeepSeek-V3 on a dataset of 23,609 articles from 49 journals in statistics and related fields. The proposed framework achieves Top-3, Top-5, and Top-10 accuracies of 40.23\%, 53.67\%, and 70.05\%, respectively. Additional analyses show that incorporating reference information generally improves recommendation performance and that recommendations remain highly stable across repeated runs, with an average Top-5 Jaccard similarity of 84\%. The framework also generates interpretable reasoning outputs that provide insights into the recommendation process. These findings demonstrate the potential of LLMs as a training-free and scalable paradigm for journal recommendation and scholarly decision support.
0
0
econ.EM 2026-06-29

Transition demand shocks lift copper and nickel prices for longer

by Andrea Bastianin, Luca Rossini +1 more

Quantifying Demand Shocks in the Green and Digital Transition

SVAR models using web-search demand indexes show these shocks outlast supply and metal-specific demand shocks in global markets.

Figure from the paper full image
abstract click to expand
We use web search data to construct monthly indexes of derived demand for cobalt, copper, and nickel, which are key inputs in technologies driving the energy and digital transitions. We incorporate these indexes into Structural Vector Autoregressive (SVAR) models of global metal markets and identify structural shocks using zero, sign, and magnitude restrictions. This approach disentangles supply shocks from several demand-side drivers of metal prices and isolates a transition demand (TD) shock linked to the diffusion of metal-intensive technologies. We find that TD shocks generate persistent price effects, especially for copper and nickel, whereas supply and metal-specific demand shocks are more immediate and less persistent.
0
0
astro-ph.IM 2026-06-26

Path signatures distinguish spectral line morphologies beyond width

by Rafael S. de Souza, Severin Bunk

The Hidden Geometry of Astrophysical Spectra: Path-Signatures of Line Profiles

Descriptors from velocity-flux paths separate profiles with identical FWHM and moments in tests, and clustering recovers velocity patterns i

Figure from the paper full image
abstract click to expand
The morphology of a spectral-line profile contains information beyond scalar summaries of line strength, centroid, width, global asymmetry, or diagnostic line ratios. Broad wings, shoulders, double peaks, secondary components, and composite emission--absorption structures encode how flux is ordered across wavelength but can remain indistinguishable under conventional summaries. We introduce an interpretable geometric representation of line profiles inspired by rough path theory. Each wavelength-sampled profile is mapped to a common systemic rest-frame velocity grid and treated as a trajectory in velocity--flux space, traversed from blue to red. From this path, we define a compact set of low-order descriptors measuring signed velocity--flux area, blue--red imbalance localization, higher-order shape complexity, and emission--absorption ordering. Using synthetic profiles, we show that these descriptors separate morphologies with similar full width at half maximum (FWHM), non-parametric velocity width ($W_{80}$), and low-order moment summaries. We then apply the method to MaNGA integral-field spectroscopy by computing H$\alpha$ descriptors in individual spaxels and clustering them in a low-dimensional feature space. The resulting classes form spatially coherent regions of similar ordered line morphology. Although no external velocity field is supplied to the clustering, stacked spectra within these regions recover coherent large-scale centroid-velocity patterns broadly consistent with the MaNGA reference velocity fields. We release a minimalist MIT-licensed package ${\it spectropath}$, available at \href{https://rafaelsdesouza.com.br/spectropath/}{the project website}.
0
0
stat.AP 2026-06-26

Deep learning cuts climate mortality forecast error by 24%

by Kenrick So, Karim Barigou +1 more

Climate-Driven Mortality Forecasting Using Deep Learning

CNN-LSTM and GNN-LSTM on top of Lee-Carter beat prior nets on French regions, with largest gains at oldest ages.

Figure from the paper full image
abstract click to expand
Climate extremes have become important drivers of mortality, producing sudden spikes that traditional mortality models fail to predict. To address this gap, we propose a two-step modelling framework that combines a regional weekly Lee-Carter baseline model that captures long-term mortality trends and overall seasonal patterns, with two complementary deep learning architectures designed to model excess mortality driven by environmental conditions and climate shocks. The first, a CNN-LSTM, captures region-specific temporal responses through convolutional filters. The second, a GNN-LSTM, replaces convolutions with graph-based representations to model spatial mortality dependencies and the propagation of climate-related impacts across regions. Both architectures are further extended to a quantile LSTM framework that produces time-varying prediction intervals. We evaluate our models against both the Lee-Carter baseline and MortFCNet (Zheng et al., 2025). Using French regional data over 1990-2019, our models capture delayed and nonlinear associations between environmental extremes and excess mortality. Both proposed architectures outperform the Lee-Carter baseline and MortFCNet across all regions, each reducing test MSE by approximately 24% relative to the MortFCNet, with particularly large gains at the oldest ages where climate-driven mortality spikes are most severe. From a risk management perspective, the proposed framework provides a more realistic characterization of extreme climate-driven mortality risk, with time-varying prediction intervals that offer a more informed basis for the assessment of climate-related longevity exposure by insurers and pension funds.
0
0
stat.ME 2026-06-26

Probabilistic top-down method scales coherent forecasts to 300k series

by Lorenzo Zambon, Dario Azzimonti +1 more

End-to-end probabilistic hierarchical forecasting of large hierarchies via probabilistic top-down

Forecasts only 0.3 percent of aggregates then draws bottom samples from historical joint distributions to reach lowest pinball loss on large

Figure from the paper full image
abstract click to expand
Retail and supply chain operations rely on demand forecasts to drive decisions, from replenishment at the product level to capacity planning at the store level. These forecasts should be probabilistic, to allow risk-aware decisions, and coherent across the aggregation hierarchy, so that decisions taken at different levels are not based on conflicting demand forecasts. However, producing coherent probabilistic forecasts is computationally demanding; at retail scale, with hierarchies of thousands of time series, this cost becomes a first-order operational concern. Existing two-step forecast-then-reconcile procedures and end-to-end neural models scale poorly, rely on restrictive assumptions, or require specialized hardware and engineering effort. We propose e2eTD, a fast and scalable method for probabilistic coherent forecasting of large hierarchical and grouped time series. e2eTD directly forecasts only a small subset of aggregate series (about 0.3\% of the hierarchy in our experiments), which are smoother and thus more predictable than the intermittent bottom series. The resulting forecast samples are propagated to the bottom level through a novel probabilistic top-down sampling algorithm, in which the historical disaggregation proportions are modeled as joint distributions, estimated in-sample. Coherent forecasts for all aggregation levels are then obtained by summing the joint bottom-level samples. On the two largest publicly available retail datasets, M5 and Favorita, e2eTD achieves the lowest weighted scaled pinball loss (the M5 competition's probabilistic score) across aggregation levels among all competing methods; it would have ranked 11th of 892 teams in the M5 Uncertainty competition. On a standard laptop, e2eTD runs in about five minutes on M5 ($\sim$40K series) and twenty minutes on Favorita ($\sim$300K series).
0
0
stat.AP 2026-06-25

Hierarchical model corrects both error types in detection-only species data

by Kabiru Abubakari, Eleni Matechou +4 more

False Positives, False Negatives, and the Detection-Only Problem: A Hierarchical Model for Species Occurrence with Observation Error

Unified framework recasts occupancy and presence-only methods as cases of one process and uses priors to make parameters identifiable.

Figure from the paper full image
abstract click to expand
Monitoring species occurrence is essential for understanding biodiversity change, informing conservation decisions, and assessing the impact of environmental pressures on ecosystems. Species occurrence data arise from different survey designs, and the statistical literature has developed distinct corresponding modelling approaches, namely occupancy models, species distribution models, and presence-only methods, whose fundamental connections have remained largely unrecognised. We argue that these are all special cases of a single hierarchical observation process. To make these connections explicit, we introduce a unified terminology centred on two data types: detection/non-detection data with T visits (DN-T) and detection-only data (DO), where DN-T with T>1 corresponds to traditional occupancy modelling, DN-1 to species distribution modelling, and DO to what the literature commonly, but we argue inaccurately, calls presence-only data. Within this framework, we study the identifiability of DO models and propose a novel hierarchical model for DO data that, for the first time, explicitly accounts for both false positive and false negative detection errors. Identifiability is achieved through prior distributions that express the natural belief that a species is more likely to be recorded where it is present than where it is absent. ...
0
0
stat.AP 2026-06-25

London crime rates and mental health referrals follow U-shape

by Nadine FΓ€ssler, Ben Moews

Crime reduction through public healthcare: Interpretable machine learning for mental health service impacts in Greater London

Positive link overall but preventive effects at low access levels point to healthcare as a crime reduction tool.

Figure from the paper full image
abstract click to expand
The relationship between crime, mental health service access, and socioeconomic deprivation in publicly-funded healthcare systems allowing impactful policy interventions offers an alternative lens to crime prevention that remains underexplored. We address this critical gap through an analysis of street-level crime data, mental health referral information, and socioeconomic metrics across Greater London, using both traditional statistical methods and machine learning techniques to identify relevant relationships and spatial patterns to reveal a persistent positive association between crime rates and mental health referrals as a proxy for service access. The prevailing prevention hypothesis is contrasted with a nuanced U-shaped relationship suggesting a contrast between preventive effects at lower service levels and demand-driven responses to crime exposure for higher referral rates. Subsequent analyses, focussing on explainable artificial intelligence, show distinct crime category patterns, with a cluster analysis identifying four borough typologies with distinct combinations of crime rates, mental health service access, and deprivation levels, requiring multifaceted approaches rather than universal solutions. This research provides one of the first comprehensive studies on this topic for the UK's publicly-funded healthcare system and introduces interpretation-oriented approaches to uncover the patterns essential to evidence-based policies.
0
0
stat.AP 2026-06-25

GLARMA negative binomial yields stabler malaria forecasts

by Adithya B. Somaraj, Praveen D. Chougale +2 more

Count data modeling and forecasting of malaria incidence using generalized time series regression

Rolling cross-validation on 2012-2019 Mumbai counts shows it handles both overdispersion and serial correlation better than Poisson or stand

Figure from the paper full image
abstract click to expand
Malaria remains a major public health concern in many urban regions of India, where timely prediction of malaria incidence is essential for effective surveillance and resource allocation. This study examines count data approaches for understanding and predicting malaria incidence in the Mumbai region. The analysis used monthly $\textit{Plasmodium vivax}$ surveillance data from the Health Management Information System (HMIS) collected between 2012 and 2019, together with meteorological variables. Initial Poisson regression models suggested strong associations between malaria incidence and environmental factors; however, diagnostic assessment revealed substantial overdispersion, indicating that the Poisson model did not adequately capture the data's variability. Negative binomial regression provided a better representation of the data and indicated that seasonal effects were more strongly associated with malaria incidence than individual climatic covariates. Residual analyses further identified significant serial dependence not captured by baseline regression models. To address this limitation, a Generalized Linear Autoregressive Moving Average (GLARMA) framework was implemented to model temporal correlation explicitly. Forecasts were generated using simulation-based methods and evaluated through rolling time series cross-validation. The GLARMA Negative binomial model consistently demonstrated superior predictive performance and greater predictive stability than competing regression and time series approaches. These findings highlight the importance of jointly accounting for overdispersion and serial dependence in malaria surveillance data and demonstrate the value of count time series models for supporting early warning systems in urban settings.
0
0
stat.AP 2026-06-25

Covariate spectral clustering recovers communities in heterogeneous networks

by Chirayata Kusari, Souvik Roy +1 more

Understanding Geopolitical Alignments Through Covariate Augmented Spectral Clustering of Heterogeneous UNGA Voting Data

The method supplies misclustering bounds and identifies geopolitical groups in UN voting records by merging edges with node covariates.

Figure from the paper full image
abstract click to expand
Community detection is a fundamental problem in network analysis. While many existing methods focus on homogeneous networks, real world networks are often heterogeneous, involving multiple node types and interaction mechanisms. In addition, node specific covariates frequently provide valuable information about the underlying community structure. Existing methodologies typically account for either network heterogeneity or covariate information, but seldom both simultaneously. In this paper, we propose a covariate assisted spectral clustering framework for heterogeneous networks that jointly utilizes network connectivity in a heterogeneous setting and node level covariates. The proposed method extends covariate assisted spectral clustering to heterogeneous settings and operates directly on the heterogeneous network without relying on projection based simplifications. Under a heterogeneous node contextualized stochastic blockmodel, we establish theoretical guarantees for the proposed procedure, including concentration results, eigenspace perturbation bounds, and an explicit upper bound on the misclustering rate. Simulation studies demonstrate that incorporating covariate information substantially improves community recovery and consistently outperforms several benchmark methods. We further apply the proposed framework to United Nations General Assembly voting data, where it reveals meaningful geopolitical structures by combining voting interactions with auxiliary covariate information.
0
0
cs.CY 2026-06-25

Causal templates from 29 cities guide e-scooter hub placement

by Meng Jin, Melanie Handrich +3 more

From Causal Discovery to Implementation: An Agentic AI Framework for E-Scooter Mobility Hub Planning Across 29 German Cities

Core demand links to activity access and transit proximity; peripheral demand to built form, with real sites now under construction.

Figure from the paper full image
abstract click to expand
Existing approaches to e-scooter mobility hub planning lack city-type-specific causal evidence. Demand models are typically correlational, built on proprietary trip data, and do not distinguish how driver profiles vary across urban typologies. This paper presents a three-phase agentic AI framework that constructs a Causal Template Library from public GBFS data across 29 German cities, encoding which environmental features causally drive hotspot demand for each combination of city type (large, university, industrial, hilly) and cluster type (core, peripheral). A large language model (LLM) orchestrated causal discovery pipeline adapts algorithm selection to local data conditions across 57 city-cluster units. The library reveals systematic variation. Core demand is driven by activity access and transit proximity, while peripheral demand responds to built form, with city-type-specific patterns supporting transferable siting templates. A planning tool built on the library scores candidate sites, calibrates infrastructure recommendations to local demographics, and generates practitioner-ready reports. In Heilbronn, Germany, two hub sites informed by the framework's causal evidence are currently under construction, illustrating how the outputs can support real-world siting decisions.
0
0
stat.AP 2026-06-25

Joint factorization ties text topics to ratings

by Cixiao Jiang, Ben Powell +1 more

Learning Interpretable Text Signals for Structured Responses

Optimizing topics for both text reconstruction and rating prediction yields stable signals competitive with separate regressions.

Figure from the paper full image
abstract click to expand
Textual data are often collected alongside structured response variables, but prediction and interpretation are commonly treated as separate tasks. This paper studies rating prediction as an initial case of interpretable text-response modelling, where the aim is to learn textual representations that are both semantically meaningful and aligned with an external response. We propose a joint non-negative matrix factorisation and binomial regression model, in which the document-topic representation is learned from both text reconstruction and rating prediction. Simulation experiments and a real-world review dataset show that the model can recover stable response-relevant textual signals and achieve competitive performance against linear and ridge regression baselines. The framework provides a practical step towards interpretable modelling of text-linked outcomes, with potential extensions to other response types beyond bounded ratings.
0
0
stat.ME 2026-06-24

Gamma overdispersion removes one latent variable per area-time pair

by Noah Ripstein, Patrick Brown +1 more

Spatio-Temporal Disaggregation with Changing Areal Boundaries

The change produces a marginal negative binomial likelihood and speeds up recovery of high-resolution risk surfaces from counts reported und

Figure from the paper full image
abstract click to expand
Small area estimation and disease mapping increasingly rely on areal data where reporting boundaries change over time. We develop a computationally efficient spatio-temporal disaggregation method to recover high-resolution risk surfaces from observed counts under changing boundaries. Our approach extends the spatially aggregated log-Gaussian Cox process and uses the Extended Latent Gaussian Model framework for fast approximate posterior inference. We replace standard lognormal polygon-specific effects with gamma-distributed overdispersion which yields a marginal negative binomial likelihood, and removes one latent variable per polygon-time pair. We illustrate the approach by mapping mortality risk across shifting NUTS-3 boundaries in Belgium and the Netherlands. For the purpose of dissemination we use Codex to leverage the methodology presented in this paper for the analysis of a separate data set concerning the city of Manchester. The methodology is implemented in the open-source R package DAST.
0
0
cs.AI 2026-06-24

Grading cascade hits 100% precision on agent outputs

by Tian Zheng, Kai-Tai Hsu

Grading the Grader: Lessons from Evaluating an Agentic Data Analysis System

Lenient grader reaches 97% recall; nudges lift success from 36% to 97% across 153 tasks

Figure from the paper full image
abstract click to expand
Agentic data analysis systems produce rich outputs, including code, numerical results, and verbal diagnostics. This makes them more challenging to evaluate than single-turn LLM responses. It is therefore necessary to distinguish genuine disagreement between an agent's output and a ground-truth answer from grading artifacts. We investigate how reliably automated graders assess such a system and what strategies improve grading quality by applying LAMBDA, a multi-agent data-analysis system, on 153 numerical QRData tasks from DSGym. We develop and evaluate a three-layer human-AI grading cascade: strict regex matching, LLM-based lenient grading, and snippet-based human inspection, which combines non-GenAI and GenAI strategies with different failure profiles. Both automated graders achieve 100% observed precision (0/70 false positives). The lenient grader's recall is 97% against human labels. A keyword-anchored extraction pipeline raises the strict grader's recall by 60 percentage points over a last-number heuristic; the lenient grader is architecturally parser-independent. An iterative nudge mechanism raises grading run success from 36% to 97% and lenient-pass rates from 16% to 46%; comparing nudging with and without original-question re-injection shows that re-injection offers no benefit, confirming the nudge as an answer template cue. We further observe in this case study that variable type is the task metadata field most consistently associated with grading pipeline dynamics and observed outcome grades.
0
0
stat.AP 2026-06-24

Model shows Cenozoic proxy correlations reverse with climate shift

by Mikkel Bennedsen, Eric Hillebrand +3 more

Continuous-time state space analysis of d18O, d13C, and CO2 in the Cenozoic Era

State-dependent random walk places CO2 thresholds for major glaciations relative to present-day levels

Figure from the paper full image
abstract click to expand
We develop a continuous-time state-space framework for the joint reconstruction of three Cenozoic climate proxies, benthic foraminiferal d18O and d13C and atmospheric CO2, from irregularly and unevenly sampled multi-site, multi-method data spanning the last 67 million years. The latent signals follow a trivariate random walk in continuous time; the measurement equation differentiates the error variance by drill site for the isotopes and by proxy group for CO2, with bias intercepts placing all sources on a common scale, and the transition equation lets the innovation covariance and a deterministic La2004 Milankovitch forcing depend on the prevailing climate state. All parameters are estimated by maximum likelihood through the Kalman filter with diffuse initialization. The estimated cross-proxy correlations reverse sign between the early Cenozoic greenhouse and the icehouse, the orbital sensitivity of the isotopes strengthens as continental ice sheets grow, and the reconstructed CO2 path, reported with calibrated confidence bands, places the atmospheric CO$_2$ thresholds of the major Cenozoic glaciations in relation to present-day concentrations.
0
0
stat.ME 2026-06-24

Bayesian model matches optimal rate for factor eigenstructure

by Seongmin Kim, Jaeyong Lee

Bayesian Estimation of the Eigenstructure in High-Dimensional Approximate Factor Models

Posterior convergence equals benchmark results while recovering factors better than principal components in simulations.

Figure from the paper full image
abstract click to expand
High-dimensional economic datasets often display strong co-movement driven by a small number of latent factors, which are typically modeled using approximate factor models. When the number of variables is large relative to the sample size, the eigenvalues and eigenvectors of the sample covariance matrix are severely distorted, which in turn makes principal component based estimators of the factor structure unstable. To address the high-dimensional problem, we propose a Bayesian model for approximate factor structures. We show that the posterior convergence rate is of the same order as benchmark results for high-dimensional spiked covariance models. Simulation studies show that the proposed method more accurately recovers the factor structure in approximate factor models than existing methods. Real data analyses on macro--financial datasets illustrate that the proposed method provides interpretable estimates of latent factor structure and performs competitively in forecasting exercises.
0
0
cs.SD 2026-06-24

Bayesian model identifies individual sound localisation parameters

by Roberto Barumerli, Fabian Brinkmann +4 more

Statistical validation and full-sphere extension of a Bayesian model for human static sound localisation

Validation shows full-sphere HRTF coverage and high-frequency fidelity determine template quality more than interpolation method.

Figure from the paper full image
abstract click to expand
Auditory models are central tools for studying spatial hearing, yet their validation typically relies on heuristic performance metrics rather than principled statistical methods. We present two contributions building on a Bayesian sound localisation model that jointly infers sound direction from noisy perceptual features and individual head-related transfer functions (HRTFs). First, we derive an explicit likelihood function and validate it through parameter recovery on simulated data and fitting to behavioural responses from 33 participants, demonstrating that the framework reliably identifies individual sensorimotor and spectral parameters. Second, we use this framework to compare four HRTF template interpolation methods, showing that full-sphere spatial coverage and high-frequency spectral fidelity are the primary determinants of template quality, while the specific interpolation algorithm is secondary. Together, these results show that standard model-based statistical methods can address both fundamental questions in spatial hearing and applied problems such as perceptual HRTF evaluation. An open-source Python implementation is released alongside this work.
0
0
stat.AP 2026-06-24

Visualizations of random variables obey the continuous mapping theorem

by Harriet Mason, Dianne Cook +2 more

A Mathematical Framework and Software Implementation for Uncertainty Visualisation

Redefining ill-defined mapping components integrates uncertainty into graphics while preserving convergence and EDA flexibility.

Figure from the paper full image
abstract click to expand
Random variables are the bread and butter of statistics, and visualisations are one of the most versatile tools in the field, so it is a wonder why we do not have a methodology for visualising random variables. This gap is particularly evident for exploratory data analysis (EDA). We address this gap by designing a mathematical framework for visualisation, which argues that we should consider visualisations to be continuous functions. In the case of random variable inputs, this means the visualisations should obey the continuous mapping theorem (CMT). By breaking the visual function down into its components, we are able to identify which parts of the mapping are ill-defined for random variable inputs and redefine them in a way that guarantees both the flexibility required for EDA and the statistical sensibility of CMT. This formalisation represents a complete integration of uncertainty into the grammar of graphics, which we show by implementing the theory in the R package, "ggdibbler". The ggdibbler software is a "ggplot2" extension that allows users to replace the data of any plotting function with a random variable, with the guarantee that the visualisation will have the same convergence properties as its underlying data.
0
0
stat.AP 2026-06-24

Recent Elo histories improve World Cup forecasts after dimension reduction

by Mina Rezaei, S. Yaser Samadi

Predicting the 2026 FIFA World Cup with Sufficient Dimension Reduction of Elo Rating Histories

Poisson models using reduced rating sequences beat standard approaches on 2018 and 2022 data

Figure from the paper full image
abstract click to expand
We study probabilistic forecasting of the 2026 FIFA World Cup, the first edition with 48 teams and an added Round of 32. The main idea is to describe team strength not only by the current Elo rating, but by a short history of recent Elo differences. We then reduce this history to a few informative directions using categorical sufficient dimension reduction (SDR). The reduced scores are used in a Poisson double-regression model for home and away goals, which gives full outcome probabilities. We compare eleven models, including logistic regression, standard Poisson regression, ARIMA, and neural-network forecasts of the Elo series, gradient boosting, an ensemble model, and four categorical SDR variants based on sliced inverse regression (SIR) and sliced average variance estimation (SAVE). The models are evaluated out of sample on the 2018 and 2022 World Cups using the ranked probability score (RPS). The results show that SDR-based poisson models improve the traditional approaches, suggesting that recent Elo history contains useful predictive information that is not captured by the current Elo difference alone.
0
0
stat.ME 2026-06-24

Pseudo-values turn recurrent counts into regression outcomes

by Zachary R. McCaw, Alex Ocampo +3 more

Pseudo-value Based Mean Cumulative Count Regression

A new approach fits standard models to estimate how covariates change event accumulation over time.

Figure from the paper full image
abstract click to expand
The mean cumulative function (MCF) summarizes how events accumulate over time for a recurrent or multi-component endpoint. The MCF, and its integral over a given time horizon, the area under the MCF (AUMCF), provide interpretable summaries of recurrent-event burden in the presence of right-censoring and terminal events. Existing approaches for these estimands have focused primarily on nonparametric treatment comparisons, covariate-adjusted augmentation, and linearized test statistics. Herein, we propose a pseudo-value-based regression approach for estimating covariate effects on the MCF and AUMCF at a fixed truncation time. The proposed method uses influence-function-based pseudo-values as regression outcomes, allowing estimation with standard generalized estimating equation machinery and, under an identity link, ordinary least squares. Through simulation studies, we evaluate estimation accuracy, confidence interval coverage, type I error control, and power across a range of recurrent-event settings. We demonstrate the utility of the proposed covariate adjustment procedure through an application to the ORATORIO clinical trial, evaluating the safety and efficacy of ocrelizumab for the treatment of primary progressive multiple sclerosis. Overall, pseudo-value-based regression provides a simple and interpretable framework for modeling covariate effects on cumulative recurrent-event burden over time.
0
0
stat.ME 2026-06-23

Approximation computes logit-normal moments to eighth order

by John Holmes, Ness Arps +1 more

Inferential applications of the moments of the logit-normal distribution

The approach avoids instability and speeds Expectation Propagation for logistic regression without handling mixed-model integrals.

abstract click to expand
Despite the implicit appearance of logit-normal random variables in many inferential problems, the logit-normal distribution is poorly studied. Most frustratingly, no default method exists for finding logit-normal moments, which are often assumed analytically unknown. In this paper, we introduce a method for estimating logit-normal moments of any positive integer order, based on approximating the logistic function. We will show our method is highly accurate up to the $8^\text{th}$ moment, avoids the numerical instability observed with Mordell integral based approximations of the first moment, and is faster than numerical integration in R. Focusing on two inferential applications, we will show our approximation methods are sufficiently accurate to enable faster implementation of Expectation Propagation for logistic regression, but is not general enough to directly evaluate the logistic normal integral that appears in some logistic mixed models.
0
0
stat.AP 2026-06-23

Peer grading tightens enterprise contract discounts at scale

by Jason Huang, Song Wei

Algorithmic Contract Design at Scale: Adaptive Peer Comparison for Enterprise Pricing

Ensemble-tree similarity scores new deals against historical peers in seconds, giving sellers an exit criterion that improves revenue outcom

Figure from the paper full image
abstract click to expand
In enterprise software, a contract commits the customer to a usage volume over a fixed term in exchange for discounted pricing. These contracts are individually negotiated across many dimensions -- size, duration, industry, product mix, usage history -- and without a data-driven reference point, discounts tend to be overly generous. Manual governance review enforces discipline but at days-scale per contract, with inconsistency across reviewers and no real-time feedback to sellers. We present \emph{Contract Scoring}, a peer-based grading system deployed on every contract at Databricks. The system identifies empirically similar historical contracts via adaptive nearest neighbors over ensemble trees, where shared leaf membership defines a data-driven similarity learned from the discount target. It returns a letter grade with per-product-line breakdown in seconds; the underlying peer set is available to the centralized review team for audit. Sellers treat the grade as a contract design ``exit criterion'', iteratively adjusting discount structures until the grade reflects their intended tradeoff. Deployment evidence shows measurable discount discipline across the scored portfolio, with a commercially significant impact on revenue.
0
0
stat.ME 2026-06-23

Calibration weights recover causal effects from misclassified exposures

by Nandini Murali, Keith Barnatchez +4 more

Causal Inference with Multiple Misclassified Exposures: A Control Variate-Adjusted Calibration Weighting Approach

Control variate adjustment adds variance reduction while the missing-data framing preserves consistency and double robustness without error

Figure from the paper full image
abstract click to expand
Exposure misclassification is a common concern in studies of respiratory infections in cystic fibrosis. Throat swabs are frequently used in place of expectorated or induced sputum cultures, although they have imperfect sensitivity and specificity to detect Pseudomonas aeruginosa and Staphylococcus aureus. We develop calibration weighting and control variate estimators for causal inference with multiple misclassified binary exposures and clustered observations. The calibration approach treats misclassification as a missing data problem, achieving consistency without modelling the misclassification mechanism. The control variate adjustment integrates information from error-prone observations to reduce variance while preserving the consistency of the gold-standard estimator. We show that the resulting estimator inherits double robustness from its component estimators. We also characterize a structural ceiling on efficiency gains in the bivariate setting, where joint correct classification of both exposures limits the variance reduction achievable relative to univariate applications. Simulation studies confirm the consistency and double robustness of the proposed estimators under model misspecification. We then apply these methods to a cohort of $651$ cystic fibrosis patients ages $6$-$21$. Swab-based estimates attenuate the effect of P. aeruginosa on percent predicted FEV$_1$ by approximately $69\%$ relative to sputum-based estimates ($-2.67$ vs. $-8.52$ percentage points; $95\%$ CI for sputum: $-13.40$, $-3.63$). These findings suggest that relying on throat swabs may lead to under-treatment of P. aeruginosa infections. More broadly, the methods provide a framework for causal inference with multiple misclassified exposures.
0
0
cs.AI 2026-06-23

Agents assist causal discovery but supply no edges or conclusions

by Yujia Zheng, Vishal Verma +4 more

Causal Discovery in the Era of Agents

LLM roles limited to data checks and assumption clarification so claims stay grounded in algorithms and observations.

abstract click to expand
Recent attempts to combine large language models (LLMs) with causal discovery ask models to infer pairwise directions, propose graph structures, or inject language-model outputs as priors and constraints. These approaches promise faster analysis, but they also obscure whether a causal evidence is supported by data and assumptions or by textual associations, prompt artifacts and hallucinated mechanisms. We argue for a different role for agents in causal discovery. Agents should inspect data, retrieve context, explain method assumptions and clarify graph outputs, but they should not supply edges, orientations, priors, constraints or causal conclusions. We propose the principle that agents assist the workflow, while causal claims remain grounded in data, explicit assumptions, formal algorithms, diagnostics and user or domain-expert decisions. We instantiate this principle in causal-learn+, an online platform that coordinates data analysis, preprocessing, method recommendation, expert-knowledge incorporation, formal discovery and interpretation around the algorithmic ecosystem of causal-learn. A case study on Big Five personality data illustrates agent-assisted pipeline of causal discovery without turning language-model unreliability into causal evidence. The platform is available at causallearn.com.
0
0
stat.AP 2026-06-23

Modal branching ratios fix exact stability threshold for switched Volterra systems

by Mauricio Herrera-MarΓ­n

Regime-Switching Volterra Operators: Modal Stability and Quenched Amplification

When the Laplacian and excitation operator commute, simultaneous diagonalization reduces stability to independent scalar modes each governed

Figure from the paper full image
abstract click to expand
We develop an operator-theoretic framework for finite-dimensional, regime-dependent Volterra equations with completely monotone memory kernels, dissipative network coupling, and Hawkes-type self-excitation. For each fixed regime we construct the associated Volterra resolvent family and prove global well-posedness, continuity across regime switches, and explicit a priori bounds. The main stability result is sharp in the commuting case: after simultaneous diagonalization of the network Laplacian and the excitation operator, each mode obeys a scalar characteristic equation, and global asymptotic stability holds exactly when every modal branching ratio lies below the intensity damping threshold. We also give a norm-based sufficient condition for noncommuting operators and a Perron--Frobenius spectral criterion for nonnegative intensity blocks, showing when norm estimates are conservative. Beyond mean stability, we prove a pathwise finite-range power law for burst amplitudes generated by residence in a Hurwitz but nonnormal regime: under a cone-alignment event, the survival exponent is the ratio of the regime exit rate to a cone-corrected finite-time growth rate bounded above by the logarithmic norm of a fixed Markovian realization in the chosen Euclidean metric. A complementary idealized-feedback result shows how a logarithmic-norm contraction caps the amplification band. Finally, we derive the deterministic intensity block as a mean-field limit of a relaxing long-memory Hawkes system with regimes. Numerical experiments on modal equations, a small-world network, and a switched nonnormal ODE validate the sharp threshold and the finite-range amplification mechanism without using the closed-form tail formula as input.
0
0
stat.AP 2026-06-23

Maternal toxicity amplifies progeny neuron damage in worm assays

by Rick Presman, Niccolo Anceschi +3 more

Order-Restricted Bayesian Ordinal Regression for the Modeling of Neuron Degeneration in Caenorhabditis elegans

Constrained Bayesian model of ordinal scores shows offspring suffer greater rotenone effects after even mild parental exposure

Figure from the paper full image
abstract click to expand
Neuron degeneration is the underlying mechanism for the development of many diseases. Quantifying the association between increasing levels of toxic exposure and progressive neuronal damage is a critical component of understanding this development. We investigate this association by analyzing a novel dataset of ordinal neuronal damage scores derived from a series of toxicological assays of C. elegans, including variables such as toxicant concentration, maternal treatment, and direct chemical exposure. We propose a computationally efficient parameter-constrained Bayesian ordinal regression that captures the monotonic association between neuron damage scores and corresponding treatments. Power analysis via simulation studies reinforces the advantages of our model over standard alternatives used in existing work by practitioners. Analysis of the novel C. elegans assays indicates that maternal toxicity increases susceptibility in progeny, with the offspring generation exhibiting amplified neuronal damage upon later-life rotenone exposure even under mild parental developmental treatment.
0
0
stat.ME 2026-06-23

Ridge regression reconciles forecasts online across hierarchies

by Tobias R{o}nlev-Knudsen, Henrik Madsen +1 more

Online forecast reconciliation using linear models

A matrix-normal linear model and recursive updates produce adaptive reconciled predictions without batch recomputation.

Figure from the paper full image
abstract click to expand
We present a framework for online and adaptive forecasting and hierarchical reconciliation using linear regression models. We begin by formalizing hierarchies using graphs, and motivated by their structure, formulate a multivariate linear model using the matrix normal distribution to characterize residuals. Parameter estimation is posed as a ridge regression problem and applied to hierarchical forecast reconciliation. The connections between ridge regression, Bayesian estimation and shrinkage for hierarchical reconciliation are discussed, and results for uncertainty quantification in parameters and forecasts are provided. Based on the ridge regression formulation, a recursive inference scheme inspired by recursive least squares is described. The algorithm is implemented in the PyOnlineForecast package. Finally, the proposed methodology is demonstrated on a case study for district heating load forecasting using a temporal hierarchy. Our results provide a reference for implementation of forecast reconciliation via multivariate linear models in an online setting. The case study furthermore highlights practical considerations of using temporal hierarchies in an online setting and demonstrates the usefulness of the proposed framework and implementation, both for district heating load forecasting and more generally for online hierarchical forecasting.
0
0
stat.AP 2026-06-23

Adaptive borrowing lifts OBD accuracy in basket trials

by Zhi Cao, Haiyan Zheng +1 more

A Bayesian Phase I/II basket design with robust information borrowing to identify subtrial-specific optimal biological doses

DF-EXNEX design raises correct subtrial-specific selections and lowers toxic picks as similarity grows

Figure from the paper full image
abstract click to expand
The objective of modern early oncology dose-finding is to identify an optimal biological dose (OBD), rather than simply the maximum tolerated dose. In basket trials, the dose-toxicity and dose-efficacy relationships may differ across biomarker or disease-defined subtrials, so a single common dose from pooled analysis may be suboptimal. We propose a flexible exchangeability-non-exchangeability (EXNEX) dose finding design (DF-EXNEX design) for subtrial-specific OBD selection in basket phase I/II trials with binary toxicity and continuous efficacy endpoints. Patient toxicity is modelled by a monotone logistic regression and efficacy by a quadratic dose-response curve. Robust borrowing is introduced through extended EXNEX mixture priors on the subtrial-specific curve parameters, allowing the strength of borrowing to adapt to the similarity of subtrials. Dose recommendation is based on an admissible set defined by posterior safety and futility rules, and an OBD-oriented utility function combining toxicity and efficacy on comparable scales. The operating characteristics were evaluated in a large-scale simulation study for the basket trial with four subtrials and five dose levels, and 70 scenarios covering all non-redundant combinations of true subtrial-specific OBD locations. Results showed that, compared with a no-borrowing NEX design, the DF-EXNEX design can increase the correct OBD selection for most scenarios while reducing overly toxic recommendation as final OBD. The improvement increased with subtrial similarity due to robust information borrowing, but a small number of mixed low/high OBD scenarios showed negative or near-zero gains, consistent with occasional over-borrowing towards intermediate doses. These results support robust borrowing for subtrial-specific OBD finding while highlighting the need to monitor borrowing behaviour when true OBDs are widely separated.
0
0
stat.ME 2026-06-23

Slope correction cuts bias in joint HRQoL-survival models

by Hortense Doms, Philippe Lambert +1 more

A Bias-Corrected Two-Stage Approach for Joint Modelling of Multidimensional Longitudinal HRQoL and Survival Data

The two-stage method matches full joint estimation accuracy at far lower computational cost for multidimensional quality-of-life data.

Figure from the paper full image
abstract click to expand
Health-related quality-of-life (HRQoL) outcomes are increasingly incorporated into oncology research to complement traditional survival endpoints by capturing patients' well-being over time. These outcomes are typically collected through multidimensional questionnaires yielding longitudinal ordinal data, and are often subject to dropout due to disease progression or death. In this context, joint models provide a well-established framework to account for the dependence between longitudinal HRQoL trajectories and time-to-event outcomes, but fully joint estimation rapidly becomes computationally prohibitive when multiple latent dimensions and random effects are involved. We propose a novel slope-corrected two-stage (SC2S) approach for the joint analysis of multivariate ordinal HRQoL data and survival outcomes within a multidimensional latent trait framework. The proposed approach propagates longitudinal information to the survival model through informative priors on the random effects, while additionally re-estimating longitudinal slope parameters. This strategy substantially reduces bias in both longitudinal and survival submodels while preserving much of the computational efficiency of two-stage procedures. Through simulation studies and an application to HRQoL data from patients with progressive glioblastoma, we show that the proposed method closely approximates fully joint Bayesian estimation while requiring notably less computation time.
0

browse all of stat.AP β†’ full archive Β· search Β· sub-categories