A Novel Methodology for Evaluating Positive Phase Blast Wave Loading Parameters Using High Speed Video
Pith reviewed 2026-06-25 20:13 UTC · model grok-4.3
The pith
Time-of-arrival data from high-speed video alone predicts blast positive phase duration and impulse to 5.3 percent mean error.
A machine-rendered reading of the paper's core claim, the machinery that carries it, and where it could break.
Core claim
The proposed methodology predicts positive phase duration and impulse for spherical, non-cased, free air bursts of ideal explosives using ta data only. Evaluated on experimental datasets for bulk and cartridge PE4, PE7, Composition B, and PETN, the models achieve mean absolute percentage errors of 5.3 percent and 5.3 percent, maximum deviations of 20 percent and 9.4 percent, absolute biases of zero and 3.1 percent, and confidence interval coverages of 86 percent and 83 percent, matching reported experimental data and enabling full spatial and temporal primary shock characterisation from video.
What carries the argument
A derivation that converts time-of-arrival versus distance curves obtained from high-speed video directly into positive phase duration and impulse values for ideal spherical bursts.
If this is right
- Blast loading parameters become obtainable in hazardous environments where pressure gauges cannot be safely deployed.
- Video recordings supply continuous spatial and temporal information on the primary shock front rather than point measurements.
- Post-event analysis of incidents such as the Beirut explosion gains quantitative positive phase estimates from existing footage.
- The approach applies to multiple ideal explosives including PE4, PE7, Composition B, and PETN with consistent reported accuracy.
Where Pith is reading between the lines
- The same ta-to-parameter mapping might be tested on non-ideal or cased charges to check whether the reported error levels persist.
- Integration with existing video analysis tools could allow real-time blast parameter estimation during testing ranges.
- If the zero-bias result holds across more datasets, the method could reduce reliance on pressure instrumentation for routine characterisation.
Load-bearing premise
Time-of-arrival data extracted from high-speed video is sufficient by itself to determine positive phase duration and impulse without direct pressure measurements or additional calibration.
What would settle it
A controlled spherical free-air burst of an ideal explosive where simultaneous pressure-gauge records of positive phase duration or impulse fall outside the video-derived confidence intervals reported in the paper.
Figures


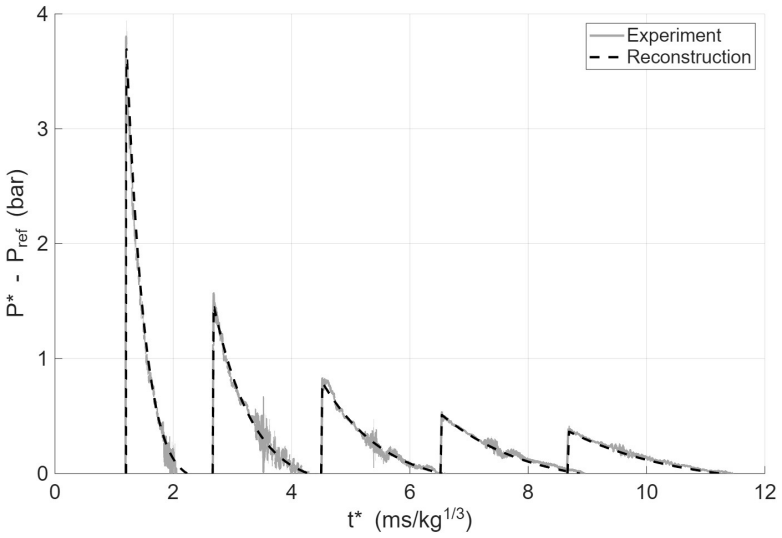

read the original abstract
Traditionally, the critical blast wave parameters used to characterize loading conditions are obtained through pressure gauge measurements. However, these instruments are costly, require careful calibration, provide discrete location measurements only, and must be deployed in hazardous environments. Recent events, such as the Beirut port explosion have demonstrated that video recordings, which provide time of arrival (ta) versus distance data, offers valuable information for post-event blast analysis. However, methodologies capable of predicting key blast parameters, such as positive phase duration and impulse, using video data alone remain limited. This work proposes and validates a novel methodology to predict positive phase duration and impulse for spherical, non-cased, free air bursts of ideal explosives using ta data only. The proposed methodology was evaluated using experimental datasets from the literature for bulk and cartridge PE4, PE7, Composition B, and PETN. The positive phase duration and impulse models achieved, respectively, mean absolute percentage errors of 5.3% and 5.3%, maximum deviations of 20% and 9.4%, absolute biases of zero and 3.1%, and confidence interval coverages of 86% and 83%. The predicted results achieve remarkable comparison to all reported experimental data, verifying the ability to capture positive phase blast loading for high speed video; a step-change in explosive characterisation through full spatial and temporal primary shock characteristics.
Editorial analysis
A structured set of objections, weighed in public.
Referee Report
Summary. The paper claims to introduce a methodology for predicting positive-phase blast-wave duration and impulse from high-speed video time-of-arrival (ta(r)) data alone for spherical free-air bursts of ideal explosives. ta(r) is used to fit charge mass via Hopkinson-Cranz scaling, yielding scaled distance Z; empirical relations depending only on Z and fitted energy release then supply the target parameters. Validation against literature pressure-gauge ground truth on separate PE4/PE7/Comp B/PETN trials yields MAPE = 5.3 % for both quantities, maximum deviations 20 % and 9.4 %, absolute biases 0 and 3.1 %, and CI coverages 86 % and 83 %.
Significance. If the reported error statistics hold, the work supplies a practical route to blast-parameter estimation when pressure gauges cannot be deployed, directly addressing post-event analysis needs illustrated by the Beirut explosion. Credit is due for the explicit use of held-out pressure-gauge comparisons with no parameter leakage from the pressure records into the ta-only predictors; this removes the circularity concern raised in the stress-test note. The approach rests on standard ideal-blast assumptions that are stated and tested within the reported scope.
minor comments (3)
- [Abstract] Abstract: the phrase 'remarkable comparison' is subjective and should be replaced by the quantitative metrics already reported.
- The functional forms of the derived empirical relations for positive-phase duration and impulse should be stated explicitly (with any fitting constants) so that the ta-to-Z pipeline can be reproduced from the video data alone.
- Figure or table captions that display the validation comparisons should indicate the exact number of held-out trials per explosive type to allow readers to assess statistical power.
Simulated Author's Rebuttal
We thank the referee for the positive assessment of the manuscript, the recognition of the held-out validation approach, and the recommendation for minor revision. No specific major comments were listed in the report.
Circularity Check
No significant circularity
full rationale
The paper extracts ta(r) from video, fits charge mass via Hopkinson-Cranz scaling to obtain Z, then applies empirical relations for positive-phase duration and impulse that depend only on Z. Validation statistics (MAPE, bias, coverage) are computed against independent pressure-gauge measurements on separate trials from the literature, with no parameter leakage from pressure records into the ta-only predictors. The central claim therefore rests on observable quantities and standard ideal-blast assumptions that are explicitly stated and tested within the reported scope; no step reduces by construction to its own inputs.
Axiom & Free-Parameter Ledger
axioms (1)
- domain assumption Time-of-arrival data from video captures the primary shock front sufficiently to determine positive phase parameters for ideal explosives.
Reference graph
Works this paper leans on
-
[1]
Explosive shocks in air
Kinney GF, Graham KJ. Explosive shocks in air. 2nd ed. Berlin: Springer-Verlag; 1985
1985
-
[2]
Pressure-impulse diagram method—A fundamental review
Chernin L, Vilnay M, Shufrin I, Cotsovos D. Pressure-impulse diagram method—A fundamental review. Proc Inst Civ Eng Eng Comput Mech 2019;172(2):55–69. https://doi.org/10.1680/jencm.17.00017
-
[3]
Experimental determination of detonation velocity
Sućeska M. Experimental determination of detonation velocity. Fragblast 1997;1:261–84
1997
-
[4]
Natural-background-oriented schlieren
Hargather MJ, Settles GS. Natural-background-oriented schlieren. Exp Fluids 2010;48:59-68. https://doi.org/10.1007/s00348-009-0709-3
-
[5]
Quantitative imaging of explosions with high-speed cameras
McNesby KL, Homan BE, Benjamin RA, Boyle VM, Densmore JM, Biss MM. Quantitative imaging of explosions with high-speed cameras. Rev Sci Instrum 2016;87(5):051301. https://doi.org/10.1063/1.4949520
-
[6]
A fragmentation assessment method for submerged charges
Nowak P, Waddoups R, Farrimond D, Gajewski T, Lodge TJ, Langdon GS, et al. A fragmentation assessment method for submerged charges. In: Proc 19th Int Symp Interaction Effects Munitions Struct; 2019
2019
-
[7]
Field Blast Tests and Finite Element Analysis of A36 Steel Sheets Subjected to High Explosives
Augusto AS, Urgessa G, Rocco JAFF, Mendonça FB, Iha. Field Blast Tests and Finite Element Analysis of A36 Steel Sheets Subjected to High Explosives. Eng 2025;6(8):187 https://doi.org/10.3390/eng6080187
-
[8]
Beirut explosion: TNT equivalence from the fireball evolution in the first 170 milliseconds
Aouad CJ, Chemissany W, Mazzali P, Temsah Y, Jahami A. Beirut explosion: TNT equivalence from the fireball evolution in the first 170 milliseconds. Shock Waves 2021;31(8):813–27. https://doi.org/10.1007/s00193-021-01031-9
-
[9]
The TNT and ANFO equivalences of the Beirut explosion
Dewey JM. The TNT and ANFO equivalences of the Beirut explosion. Shock Waves 2021;31(1):95–9. https://doi.org/10.1007/s00193-021-00992-1
-
[10]
Explosion analysis from images: Trinity and Beirut
Díaz JS. Explosion analysis from images: Trinity and Beirut. Eur J Phys 2021;42(3):034001. https://doi.org/10.1088/1361-6404/abe131
-
[11]
Karlsen J, Farrimond DG, Lodge TJ, Rigby SE, Tyas A, Clarke SD, et al. Trilateration of blast wave arrival time: An inverse method for determining explosive yield and position. Philos Trans R Soc A 2025;383(2305):20240040. https://doi.org/10.1098/rsta.2024.0040
-
[12]
Preliminary yield estimation of the 2020 Beirut explosion using video footage from social media
Rigby SE, Lodge TJ, Alotaibi S, Barr AD, Clarke SD, Langdon GS, et al. Preliminary yield estimation of the 2020 Beirut explosion using video footage from social media. Shock Waves 2020;30(6):671–5. https://doi.org/10.1007/s00193-020-00970-z
-
[13]
A Mamba-Based Multimodal Network for Multiscale Blast-Induced Rapid Structural Damage Assessment
Ma W, Sivasakthy S, Farrimond DG, Dennis AA, Rigby SE. A Mamba-Based Multimodal Network for Multiscale Blast-Induced Rapid Structural Damage Assessment. arXiv preprint. arXiv:2604.11709, 2026
work page internal anchor Pith review Pith/arXiv arXiv 2026
-
[14]
Airblast parameters from TNT spherical air burst and hemispherical surface burst
Kingery CN, Bulmash G. Airblast parameters from TNT spherical air burst and hemispherical surface burst. Aberdeen Proving Ground: US Army Ballistic Research Laboratory; 1984
1984
-
[15]
Blast wave time of arrival: A reliable metric to determine pressure and yield of high explosive detonations
Rigby SE. Blast wave time of arrival: A reliable metric to determine pressure and yield of high explosive detonations. FABIG Newslett 2021;(79):18–25
2021
-
[16]
Time of arrival as a diagnostic for far-field high explosive blast waves
Farrimond DG, Rigby SE, Clarke SD, Tyas A. Time of arrival as a diagnostic for far-field high explosive blast waves. Int J Prot Struct 2022;13(1):3–25. https://doi.org/10.1177/20414196211062923
-
[17]
A constant trinitrotoluene equivalence fit for blast wave position versus time data
Amorim CB, Augusto AS, Gonçalves RFB. A constant trinitrotoluene equivalence fit for blast wave position versus time data. Propellants Explos Pyrotech 2025;50(7):44–54. https://doi.org/10.1002/prep.12071
-
[18]
Optical measurement and scaling of blasts from gram-range explosive charges
Hargather MJ, Settles GS. Optical measurement and scaling of blasts from gram-range explosive charges. Shock Waves 2007;17:215–23. https://doi.org/10.1007/s00193-007-0108-8
-
[19]
Scaling, characterization, and application of gram-range explosive charges to blast testing of materials
Hargather MJ. Scaling, characterization, and application of gram-range explosive charges to blast testing of materials. PhD dissertation. Pennsylvania State University; 2008
2008
-
[20]
Characterization of blasts from laboratory-scale composite explosive charges
Biss MM. Characterization of blasts from laboratory-scale composite explosive charges. PhD dissertation. Pennsylvania State University; 2009
2009
-
[21]
Optically measured explosive impulse
Biss MM, McNesby KL. Optically measured explosive impulse. Exp Fluids 2014;55:1749. https://doi.org/10.1007/s00348-014-1749-x
-
[22]
Initial decay of flow properties of planar, cylindrical and spherical blast waves
Sadek HSI, Gottlieb JJ. Initial decay of flow properties of planar, cylindrical and spherical blast waves. Delft: Delft University of Technology; 1983
1983
-
[23]
Time dependent blast wave properties from shock wave tracking with high speed video
Anderson JG, Parry SL, Ritzel DV. Time dependent blast wave properties from shock wave tracking with high speed video. In: Proc Military Aspects of Blast and Shock; 2016
2016
-
[24]
Air blast parameters versus distance for hemispherical TNT surface bursts
Kingery N. Air blast parameters versus distance for hemispherical TNT surface bursts. Aberdeen Proving Ground: US Army Ballistic Research Laboratory; 1966
1966
-
[25]
Numerical solutions of spherical blast waves
Brode HL. Numerical solutions of spherical blast waves. RM-1363-AEC. Santa Monica: RAND Corporation; 1954
1954
-
[26]
Anas SM, Alam M. Comparison of existing empirical equations for blast peak positive overpressure from spherical free air and hemispherical surface bursts. Iran J Sci Technol Trans Civ Eng 2022;46(2):965–84. https://doi.org/10.1007/s40996-021-00718-4
-
[27]
Rigby SE, Tyas A, Fay SD, Clarke SD, Warren JA. Validation of semi-empirical blast pressure predictions for far field explosions - is there inherent variability in blast wave parameters? In: Proc 6th international conference on protection of structures against hazards; 2014
2014
-
[28]
Characterisation of Blast Loading from Ideal and Non-Ideal Explosives
Farrimond DG. Characterisation of Blast Loading from Ideal and Non-Ideal Explosives. PhD dissertation. University of Sheffield; 2024
2024
-
[29]
British ordnance board minutes 13565
Hopkinson, B. British ordnance board minutes 13565. Kew, UK: The National Archives
-
[30]
Lehrbuch der Ballistik
Cranz, KJ. Lehrbuch der Ballistik. Berlin: Springer; 1936
1936
-
[31]
Comparison of the TNT equivalency of spheres and cylinders of PE4 and PE7
Manalvo V. Comparison of the TNT equivalency of spheres and cylinders of PE4 and PE7. Tech rep; 2013
2013
-
[32]
Yu H, Li Z, Wang X. Probabilistic analysis of near-field blast loads considering fireball surface instabilities and stochastic detonator location. Struct Saf 2024;109:102522. https://doi.org/10.1016/j.strusafe.2024.102522
-
[33]
A simplified approach to modelling blasts in computational fluid dynamics (CFD)
Mohotti D, Wijesooriya K, Weckert S. A simplified approach to modelling blasts in computational fluid dynamics (CFD). Def Technol 2023;23:19-34. https://doi.org/10.1016/j.dt.2022.11.006
-
[34]
Experimental and empirical study for prediction of blast loads
Zhang T, Liu Y, Chen X. Experimental and empirical study for prediction of blast loads. Appl Sci 2022;12(5):2691. https://doi.org/10.3390/app12052691
-
[35]
Prediction intervals too narrow
Hyndman RJ. Prediction intervals too narrow. 2014. Available at: https://robjhyndman.com/hyndsight/narrow-pi/ [accessed 23 Apr 2026]
2014
-
[36]
A state space framework for automatic forecasting using exponential smoothing methods
Hyndman RJ, Koehler AB, Snyder RD, Grose S. A state space framework for automatic forecasting using exponential smoothing methods. Int J Forecast 2002;18:439–54
2002
-
[37]
Machine learning-based prediction of structural response under blast loading
Li Q, Wang Y, Zhang H. Machine learning-based prediction of structural response under blast loading. Appl Sci 2025;15(3):1147. https://doi.org/10.3390/app15031147. Appendix A: Data processing for bulk and cartridge PE4, and PE7 The measurements were extracted directly from the graphs provided in Appendix D [31], which present the pressure-time profiles in...
discussion (0)
Sign in with ORCID, Apple, or X to comment. Anyone can read and Pith papers without signing in.