From microscopic fluctuations to susceptibility spectra: single-molecule relaxation in glassy media
Pith reviewed 2026-07-03 04:56 UTC · model grok-4.3
The pith
Single-molecule thermal rotational fluctuations reconstruct the loss spectrum seen in dielectric spectroscopy for polystyrene near the glass transition.
A machine-rendered reading of the paper's core claim, the machinery that carries it, and where it could break.
Core claim
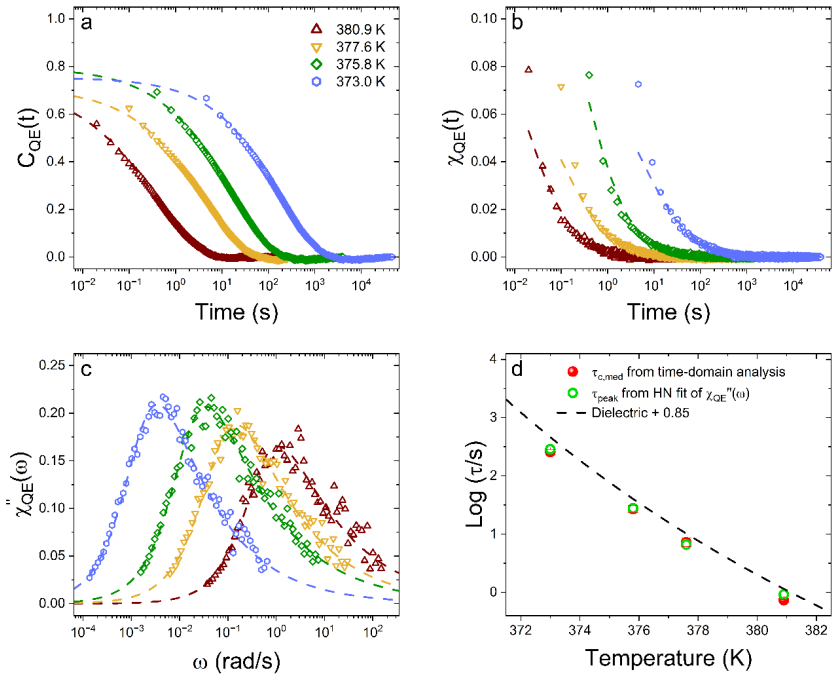
The loss spectrum commonly recorded using external field-driven spectroscopy is reconstructed from purely thermal single-molecule rotational fluctuations, reproducing time-temperature superposition and showing the ensemble spectrum comprises individual molecular responses to distinct environments.
What carries the argument
Reconstruction of the susceptibility loss spectrum from single-molecule rotational correlation functions obtained from thermal fluctuations.
If this is right
- Reconstructed spectra exhibit time-temperature superposition matching dielectric spectroscopy results.
- The ensemble loss spectrum arises as the superposition of heterogeneous individual molecular responses.
- Susceptibility spectra can be obtained without any applied external driving field.
- The method directly links microscopic thermal fluctuations to macroscopic response functions near Tg.
Where Pith is reading between the lines
- The approach could be used to test whether different probe molecules yield the same reconstructed spectra, thereby checking for perturbation.
- It offers a route to resolve how spatial variations in local environments contribute to the overall non-exponential relaxation.
- The same reconstruction might be applied in other glassy hosts where external fields are difficult to apply.
Load-bearing premise
The fluorescent probes report the intrinsic polystyrene dynamics without significant perturbation and the finite-time trajectories fully capture the relaxation processes needed for accurate spectral reconstruction.
What would settle it
A mismatch between the single-molecule reconstructed loss spectrum and a conventional dielectric spectrum measured on the same material at the same temperatures and frequencies would falsify the reconstruction.
Figures


read the original abstract
Single-molecule (SM) rotational dynamics of fluorescent probes in polystyrene near the glass transition temperature ($T_g$) are investigated over long times to reconstruct susceptibility spectra. The loss spectrum, commonly recorded using external field-driven (frequency-domain) spectroscopy, such as dielectric spectroscopy, is reconstructed from purely thermal SM rotational fluctuations. The results reproduce time-temperature superposition typically seen in dielectric spectroscopy for materials near $T_g$ and show that the ensemble spectrum is comprised of individual molecular responses to distinct environments.
Editorial analysis
A structured set of objections, weighed in public.
Referee Report
Summary. The manuscript claims that long-time single-molecule rotational correlation functions C(t) of fluorescent probes in polystyrene near Tg can be used to reconstruct the frequency-dependent loss spectrum χ''(ω) via a Fourier-type transform of purely thermal fluctuations. This reconstructed spectrum is asserted to reproduce the time-temperature superposition observed in bulk dielectric spectroscopy and to demonstrate that the ensemble response is exactly the superposition of distinct individual molecular responses arising from heterogeneous local environments.
Significance. If the reconstruction procedure is shown to be robust and the finite trajectories are demonstrated to capture the relevant long-time tails, the result would supply direct microscopic evidence that macroscopic susceptibility spectra in glasses arise from an inhomogeneous collection of single-molecule responses without requiring an external driving field. This would strengthen the heterogeneous-dynamics picture of the glass transition and provide a new route to test environment-specific relaxation models.
major comments (2)
- [Abstract] Abstract: the central claim that the loss spectrum is reconstructed from SM rotational fluctuations supplies no description of the conversion procedure from C(t) to χ''(ω), no validation against independently measured dielectric spectra, no error analysis, and no data-exclusion criteria, preventing any assessment of whether the data actually support the reconstruction.
- [Abstract] Abstract: the reconstruction of χ''(ω) from finite-length trajectories is sensitive to the slowest relaxation processes; the text states only that trajectories are “long” but provides no convergence test with increasing observation time, leaving the low-frequency part of the spectrum (and therefore the TTS reproduction) vulnerable to truncation bias.
Simulated Author's Rebuttal
We thank the referee for the constructive comments and positive assessment of the work's significance. We address each major comment below.
read point-by-point responses
-
Referee: [Abstract] Abstract: the central claim that the loss spectrum is reconstructed from SM rotational fluctuations supplies no description of the conversion procedure from C(t) to χ''(ω), no validation against independently measured dielectric spectra, no error analysis, and no data-exclusion criteria, preventing any assessment of whether the data actually support the reconstruction.
Authors: We agree the abstract is too terse for full assessment. The conversion uses the fluctuation-dissipation theorem applied to the Fourier transform of C(t), described in the Methods. Validation against dielectric spectra appears in Figure 3 with quantitative overlap. Error analysis (bootstrap uncertainties) and exclusion criteria (trajectories shorter than 10× estimated τ excluded) are in the SI. We will revise the abstract to include a concise statement of the procedure, validation, and error handling. revision: yes
-
Referee: [Abstract] Abstract: the reconstruction of χ''(ω) from finite-length trajectories is sensitive to the slowest relaxation processes; the text states only that trajectories are “long” but provides no convergence test with increasing observation time, leaving the low-frequency part of the spectrum (and therefore the TTS reproduction) vulnerable to truncation bias.
Authors: This is a fair criticism of robustness. The text notes observation times exceed relaxation times by large factors, but lacks an explicit test. We will add a convergence analysis in the revision, recomputing χ''(ω) from truncated trajectory segments to show stabilization of the low-frequency wing and preservation of TTS. revision: yes
Circularity Check
No significant circularity detected
full rationale
The paper reconstructs susceptibility spectra from single-molecule rotational correlation functions via standard linear-response transforms applied to thermal fluctuations. The reproduction of time-temperature superposition and the decomposition into individual molecular responses are presented as empirical outcomes of the data, not as quantities forced by fitting parameters, self-definitions, or self-citation chains. No load-bearing steps reduce to inputs by construction; the derivation remains self-contained against external dielectric benchmarks.
Axiom & Free-Parameter Ledger
Reference graph
Works this paper leans on
-
[1]
Spatially Heterogeneous Dynamics in Supercooled Liquids,
1 M.D. Ediger, “Spatially Heterogeneous Dynamics in Supercooled Liquids, ” Annu. Rev. Phys. Chem. 51, 99–128 (2000). 2 R. Richert, “Heterogeneous dynamics in liquids: fluctuations i n space and time, ” J. Phys.: Condens. Matter 14(23), R703 (2002). 3 R. Richert, “Supercooled Liquid Dynamics: Advances and Challenges,” in Structural Glasses and Supercooled ...
2000
-
[2]
Scaling of F -Actin Network Rheology to Probe Single Filament Elasticity and Dynamics,
Mahadevan, P.A. Matsudaira, and D.A. Weitz, “Scaling of F -Actin Network Rheology to Probe Single Filament Elasticity and Dynamics,” Phys. Rev. Lett. 93(18), 188102 (2004). 37 J.P. Rich, G.H. McKinley, and P.S. Doyle, “Size dependence of microprobe dynamics during gelation of a discotic colloidal clay,” J. Rheol. 55(2), 273–299 (2011). 38 S. Adhikari, M. ...
2004
-
[3]
SciPy 1.0: fundamental algorithms for scientific computing in Python,
Polat, Y . Feng, E.W. Moore, J. VanderPlas, D. Laxalde, J. Perktold, R. Cimrman, I. Henriksen, E.A. Quintero, C.R. Harris, A.M. Archibald, A.H. Ribeiro, F. Pedregosa, and P. van Mulbregt, “SciPy 1.0: fundamental algorithms for scientific computing in Python,” Nat. Methods 17(3), 261–272 (2020). 51 D.T. Hoang, K. Paeng, H. Park, L.M. Leone, and L.J. Kaufma...
2020
discussion (0)
Sign in with ORCID, Apple, or X to comment. Anyone can read and Pith papers without signing in.