What Does the Virial Coefficient of the Hb Broad-Line Region Depend On?
Pith reviewed 2026-05-24 09:38 UTC · model grok-4.3
The pith
The virial coefficient for the broad-line region correlates with black hole mass when calibrated against dynamical masses.
A machine-rendered reading of the paper's core claim, the machinery that carries it, and where it could break.
Core claim
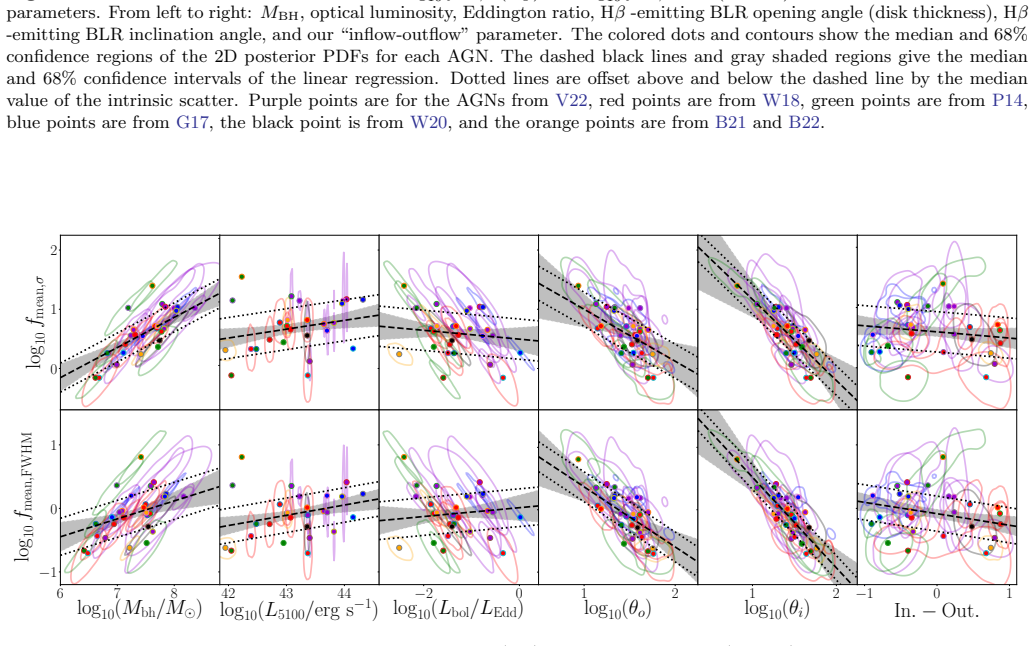
By anchoring reverberation mapping data to independent dynamical black hole masses, the authors recover per-object scale factors and report evidence that the mean virial coefficient log10(f_mean,σ) correlates with black hole mass, along with marginal evidence that disk thickness and inclination anti-correlate with certain f measures and that line-profile shape correlates with log10(f_rms,σ).
What carries the argument
The virial coefficient f recovered as dynamical mass divided by the reverberation-mapping virial product (R ΔV²/G), allowing individual calibration instead of a single average value.
If this is right
- Reverberation mapping masses estimated with a single average f carry mass-dependent systematic errors.
- The broad-line region geometry or kinematics change with black hole mass.
- The line dispersion measured in the mean spectrum produces a more mass-sensitive f than FWHM-based versions.
- Inclination and disk thickness affect the observed line widths and therefore the recovered f values.
Where Pith is reading between the lines
- A mass-dependent f relation could be applied to improve single-epoch mass estimates for large quasar samples where dynamical modeling is impossible.
- The correlation might reflect changes in accretion rate or radiation pressure that alter BLR structure at higher masses.
- Orientation effects captured by the inclination anti-correlations could help explain part of the scatter in traditional f distributions.
Load-bearing premise
Black hole masses obtained from dynamical modeling are accurate and share no hidden assumptions with the reverberation mapping measurements used to compute the virial products.
What would settle it
No correlation between log10(f_mean,σ) and black hole mass appears in an independent sample of AGN that have both dynamical modeling masses and reverberation mapping data.
Figures




read the original abstract
We combine our dynamical modeling black hole mass measurements from the Lick AGN Monitoring Project 2016 sample with measured cross-correlation time lags and line widths to recover individual scale factors, f, used in traditional reverberation mapping analyses. We extend our sample by including prior results from Code for AGN Reverberation and Modeling of Emission Lines (caramel) studies that have utilized our methods. Aiming to improve the precision of black hole mass estimates, as well as uncover any regularities in the behavior of the broad-line region (BLR), we search for correlations between f and other AGN/BLR parameters. We find (i) evidence for a correlation between the virial coefficient log10(fmean,{\sigma}) and black hole mass, (ii) marginal evidence for a similar correlation between log10(frms,{\sigma}) and black hole mass, (iii) marginal evidence for an anti-correlation of BLR disk thickness with log10(fmean,FWHM)and log10(frms,FWHM), and (iv) marginal evidence for an anti-correlation of inclination angle with log10(fmean,FWHM), log10(frms,{\sigma}), and log10(fmean,{\sigma}). Lastly, we find marginal evidence for a correlation between line-profile shape, when using the root-meansquare spectrum, log10(FWHM/{\sigma})rms, and the virial coefficient, log10(frms,{\sigma}), and investigate how BLR properties might be related to line-profile shape using caramel models.
Editorial analysis
A structured set of objections, weighed in public.
Referee Report
Summary. The paper recovers individual virial coefficients f by dividing dynamical modeling black hole masses (from caramel on LAMP 2016 and prior samples) by reverberation-mapping virial products derived from the same light curves and spectra. It then searches for correlations between these f values (mean and rms, using σ and FWHM) and AGN/BLR parameters, reporting (i) evidence for a correlation between log10(f_mean,σ) and black hole mass, (ii) marginal evidence for a similar correlation with log10(f_rms,σ), and (iii-iv) marginal evidence for anti-correlations involving BLR disk thickness, inclination, and line-profile shape.
Significance. A robust, non-artifactual correlation between the virial coefficient and black hole mass would be significant for refining single-epoch or RM mass estimates and for constraining BLR geometry. The approach of calibrating f directly from dynamical models is a methodological strength when the two mass estimates are demonstrably independent.
major comments (2)
- [Abstract and f-recovery section] Abstract and the section deriving individual f values: f is recovered directly as M_dyn / VP with VP = c τ ΔV²/G from the identical LAMP 2016 data used for caramel dynamical modeling. The reported correlation between log10(f_mean,σ) and black hole mass (M_BH ≡ M_dyn) is therefore equivalent to a correlation between M_dyn and VP; without explicit mock-data tests or error-budget decomposition to exclude correlated uncertainties in τ or line width arising from shared sampling, S/N, or model assumptions, it is unclear whether the correlation is physical. This directly affects the central claim (i).
- [Results section] Results section on correlations: the abstract states specific findings but provides no error budgets, sample-selection criteria, or tests against modeling systematics. If these are also absent from the full analysis, small-number statistics or post-hoc choices could affect the significance of the reported f-M_BH correlation and the marginal results.
minor comments (2)
- [Notation] Notation for f_mean vs. f_rms and σ vs. FWHM should be defined once and used consistently in all figures and tables.
- [Figures] Correlation plots should include individual error bars on both axes and report the Spearman or Pearson coefficient with its p-value.
Simulated Author's Rebuttal
We thank the referee for their careful reading and insightful comments, which have helped us improve the clarity and robustness of our analysis. We address each major comment below and indicate revisions made to the manuscript.
read point-by-point responses
-
Referee: [Abstract and f-recovery section] Abstract and the section deriving individual f values: f is recovered directly as M_dyn / VP with VP = c τ ΔV²/G from the identical LAMP 2016 data used for caramel dynamical modeling. The reported correlation between log10(f_mean,σ) and black hole mass (M_BH ≡ M_dyn) is therefore equivalent to a correlation between M_dyn and VP; without explicit mock-data tests or error-budget decomposition to exclude correlated uncertainties in τ or line width arising from shared sampling, S/N, or model assumptions, it is unclear whether the correlation is physical. This directly affects the central claim (i).
Authors: We agree that f = M_dyn / VP by construction and that this implies a relationship between the reported log f–M_BH correlation and the underlying M_dyn–VP plane. However, M_dyn is not equivalent to a simple virial product: caramel performs a global fit to the full velocity-resolved reverberation dataset, constraining a physically motivated BLR geometry, kinematics, and inclination that are independent of the scalar cross-correlation lag and single line-width measure used for VP. The modeling therefore incorporates information (e.g., differential lags across the line profile) that is not present in VP. We acknowledge that shared data could introduce correlated uncertainties and that the original manuscript did not present explicit mock-data tests. In the revised version we have added (i) a dedicated error-budget decomposition separating statistical uncertainties in τ and ΔV from modeling systematics in M_dyn, and (ii) mock-data simulations that inject known BLR geometries and recover f values to demonstrate that the observed correlation is not reproduced by sampling or S/N effects alone. revision: yes
-
Referee: [Results section] Results section on correlations: the abstract states specific findings but provides no error budgets, sample-selection criteria, or tests against modeling systematics. If these are also absent from the full analysis, small-number statistics or post-hoc choices could affect the significance of the reported f-M_BH correlation and the marginal results.
Authors: The full manuscript already contains error budgets for the recovered f values (propagated from both M_dyn and VP uncertainties) and describes the sample-selection criteria (LAMP 2016 objects with successful caramel models plus prior caramel samples meeting the same quality cuts). We also tested robustness against modeling systematics by repeating the correlation analysis under alternate caramel priors and line-width definitions. Nevertheless, we accept that these elements were not sufficiently highlighted or cross-referenced in the results section. In revision we have (i) added explicit cross-references to the error budgets and selection criteria, (ii) included bootstrap and jackknife significance tests that account for the modest sample size, and (iii) clarified that the reported marginal correlations were pre-specified rather than post-hoc. These changes strengthen the presentation without altering the conclusions. revision: partial
Circularity Check
f recovered as M_dyn/VP; reported f-M_BH correlation reduces to M_dyn-VP relation by construction
specific steps
-
self definitional
[Abstract]
"We combine our dynamical modeling black hole mass measurements from the Lick AGN Monitoring Project 2016 sample with measured cross-correlation time lags and line widths to recover individual scale factors, f, used in traditional reverberation mapping analyses. ... We find (i) evidence for a correlation between the virial coefficient log10(fmean,σ) and black hole mass"
f is obtained exactly as f = M_dyn / VP. Correlating the resulting log f with log M_dyn is therefore identical to correlating log(M_dyn / VP) with log M_dyn, which is fixed once the M_dyn–VP relation is measured; the reported dependence is not an independent prediction but a restatement of how the two mass estimates differ.
full rationale
The paper recovers individual f values directly from dynamical masses divided by the reverberation-mapping virial product (VP = c τ ΔV²/G) using the same LAMP 2016 data. It then reports a correlation between log f and black hole mass (M_dyn). Because log f ≡ log M_dyn − log VP by definition, any such correlation is mathematically equivalent to a (negative) correlation between log M_dyn and log VP; no independent physical content about BLR structure is added. The abstract states the recovery method and the correlation finding without mock tests separating shared modeling assumptions or data. This matches the self-definitional pattern at score 7; other claims (e.g., inclination or thickness trends) are marginal and not load-bearing for the central result.
Axiom & Free-Parameter Ledger
free parameters (1)
- individual f values
axioms (1)
- domain assumption Dynamical modeling yields unbiased black hole masses independent of reverberation-mapping geometry assumptions
Forward citations
Cited by 1 Pith paper
-
OzDES Reverberation Mapping of Active Galactic Nuclei: Final Data Release, Black-Hole Mass Results, & Scaling Relations
OzDES final release delivers 62 new reverberation-mapped black hole masses and tighter lag-luminosity relations for Hβ, MgII, and CIV in high-redshift AGN after correcting for survey-length selection effects.
Reference graph
Works this paper leans on
- [1]
-
[2]
Barth, A. J., Bennert, V. N., Canalizo, G., et al. 2015, ApJS, 217, 26
work page 2015
-
[3]
Batiste, M., Bentz, M. C., Raimundo, S. I., Vestergaard, M., & Onken, C. A. 2017, ApJL, 838, L10
work page 2017
-
[4]
N., Treu, T., Woo, J.-H., et al
Bennert, V. N., Treu, T., Woo, J.-H., et al. 2010, ApJ, 708, 1507
work page 2010
- [5]
-
[6]
Bentz, M. C., Denney, K. D., Cackett, E. M., et al. 2006, ApJ, 651, 775
work page 2006
- [7]
- [8]
-
[9]
Denney, K. D., Peterson, B. M., Pogge, R. W., et al. 2010, ApJ, 721, 715
work page 2010
-
[10]
2020, The Astrophysical Journal, 888, 37
Ding, X., Silverman, J., Treu, T., et al. 2020, The Astrophysical Journal, 888, 37
work page 2020
-
[11]
Emmering, R. T., Blandford, R. D., & Shlosman, I. 1992, ApJ, 385, 460 What Does the Geometry of the Hβ BLR Depend On? 17
work page 1992
- [12]
- [13]
-
[14]
Gebhardt, K., Bender, R., Bower, G., et al. 2000, ApJL, 539, L13
work page 2000
- [15]
-
[16]
2011, MNRAS, 412, 2211 Gravity Collaboration, Sturm, E., Dexter, J., et al
Combes, F. 2011, MNRAS, 412, 2211 Gravity Collaboration, Sturm, E., Dexter, J., et al. 2018, Nature, 563, 657 Gravity Collaboration, Amorim, A., Baub¨ ock, M., et al. 2020, A&A, 643, A154
work page 2011
-
[17]
Grier, C. J., Pancoast, A., Barth, A. J., et al. 2017, ApJ, 849, 146
work page 2017
-
[18]
Grier, C. J., Peterson, B. M., Pogge, R. W., et al. 2012, ApJ, 755, 60
work page 2012
-
[19]
Grier, C. J., Martini, P., Watson, L. C., et al. 2013, ApJ, 773, 90
work page 2013
-
[20]
Jorstad, S. G., Marscher, A. P., Lister, M. L., et al. 2005, AJ, 130, 1418
work page 2005
- [21]
-
[22]
Kelly, B. C. 2007, ApJ, 665, 1489
work page 2007
-
[23]
Kishimoto, M., H¨ onig, S. F., Antonucci, R., et al. 2011, A&A, 536, A78
work page 2011
-
[24]
2011, Baltic Astronomy, 20, 400 —
Kollatschny, W., & Zetzl, M. 2011, Baltic Astronomy, 20, 400 —. 2013, A&A, 549, A100
work page 2011
-
[25]
Konigl, A., & Kartje, J. F. 1994, ApJ, 434, 446
work page 1994
-
[26]
Kormendy, J., & Ho, L. C. 2013, ARA&A, 51, 511
work page 2013
- [27]
-
[28]
2015, in TORUS2015: The AGN Unification Scheme After 30 Years, ed
Koshida, S. 2015, in TORUS2015: The AGN Unification Scheme After 30 Years, ed. P. Gandhi & S. F. Hoenig
work page 2015
-
[29]
Magorrian, J., Tremaine, S., Richstone, D., et al. 1998, AJ, 115, 2285
work page 1998
-
[30]
A., Ferrarese, L., Merritt, D., et al
Onken, C. A., Ferrarese, L., Merritt, D., et al. 2004, ApJ, 615, 645
work page 2004
- [31]
-
[32]
Pancoast, A., Brewer, B. J., Treu, T., et al. 2014, MNRAS, 445, 3073
work page 2014
- [33]
-
[34]
Peterson, B. M. 1993, PASP, 105, 247
work page 1993
-
[35]
Peterson, B. M., Ferrarese, L., Gilbert, K. M., et al. 2004, ApJ, 613, 682
work page 2004
-
[36]
Pringle, J. E. 1981, ARA&A, 19, 137
work page 1981
-
[37]
A., Gebhardt, K., & Bonning, E
Salviander, S., Shields, G. A., Gebhardt, K., & Bonning, E. W. 2007, The Astrophysical Journal, 662, 131
work page 2007
- [38]
-
[39]
2013, Bulletin of the Astronomical Society of India, 41, 61
Shen, Y. 2013, Bulletin of the Astronomical Society of India, 41, 61
work page 2013
-
[40]
Shields, G. A., & Salviander, S. 2009, in Astronomical Society of the Pacific Conference Series, Vol. 419, Galaxy Evolution: Emerging Insights and Future Challenges, ed. S. Jogee, I. Marinova, L. Hao, & G. A. Blanc, 392
work page 2009
-
[41]
Targett, T. A., Dunlop, J. S., & McLure, R. J. 2012, Monthly Notices of the Royal Astronomical Society, 420, 3621
work page 2012
-
[42]
Treu, T., Malkan, M. A., & Blandford, R. D. 2004, ApJL, 615, L97 U, V., Barth, A. J., Vogler, H. A., et al. 2022, ApJ, 925, 52 Villafa˜ na, L., Williams, P. R., Treu, T., et al. 2022, The Astrophysical Journal, 930, 52
work page 2004
- [43]
-
[44]
R., Pancoast, A., Treu, T., et al
Williams, P. R., Pancoast, A., Treu, T., et al. 2018, ApJ, 866, 75 —. 2020, ApJ, 902, 74
work page 2018
- [45]
-
[46]
Woo, J.-H., Treu, T., Malkan, M. A., & Blandford, R. D. 2006, ApJ, 645, 900 —. 2008, ApJ, 681, 925
work page 2006
-
[47]
Woo, J.-H., Yoon, Y., Park, S., Park, D., & Kim, S. C. 2015, ApJ, 801, 38
work page 2015
- [48]
discussion (0)
Sign in with ORCID, Apple, or X to comment. Anyone can read and Pith papers without signing in.