Measuring Racial Disparities in Rent Growth Under Algorithmic Landlord Concentration in U.S. Metros
Pith reviewed 2026-06-30 10:08 UTC · model grok-4.3
The pith
Corporate landlord concentration is associated with higher rent growth, especially in majority-minority neighborhoods.
A machine-rendered reading of the paper's core claim, the machinery that carries it, and where it could break.
Core claim
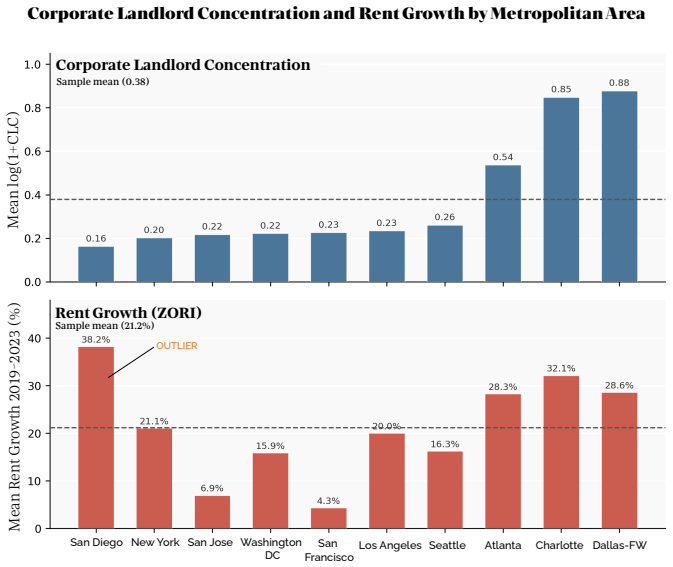
Across 665 census tracts, doubling REIT concentration is associated with 2.8 percentage points higher rent growth (p=0.086, p=0.030 HC1 robust). This association is significantly stronger in majority-minority tracts. Within the same metro, high-CLC majority-minority tracts are associated with 5.9 percentage points higher rent growth than comparable white tracts (p=0.039). An XGBoost model predicts 44 percent of out-of-sample rent growth variance, with SHAP analysis confirming that CLC's contribution is positive in minority tracts and negative in white tracts.
What carries the argument
Corporate landlord concentration (CLC), a tract-level density measure of REIT-owned properties geocoded from SEC 10-K filings, entered into regressions and an XGBoost model while controlling for the Algorithmic Housing Burden Index (AHBI) composite of prior rent burden and market tightness.
If this is right
- If the measured associations reflect real effects, algorithmic coordination among REITs would contribute to uneven rent trajectories by neighborhood racial composition.
- Within-metro comparisons imply that the same level of CLC produces larger rent increases where minority residents predominate.
- The out-of-sample predictive accuracy of the XGBoost model indicates that CLC adds explanatory power beyond standard housing-burden controls.
- The sign reversal of CLC's SHAP contribution across racial composition groups points to a mechanism that amplifies rather than equalizes rent outcomes.
Where Pith is reading between the lines
- If the disparity persists after stricter controls for landlord selection, targeted limits on algorithmic pricing tools could narrow racial gaps in rent growth.
- The pattern invites parallel analysis in metros not covered by the ten studied here to test geographic consistency.
- Longitudinal tracking of ownership changes after the 2024 DOJ complaint could reveal whether reduced coordination alters the observed CLC-rent link.
Load-bearing premise
That the Algorithmic Housing Burden Index sufficiently accounts for corporate landlords preferentially locating in neighborhoods already seeing rent appreciation.
What would settle it
Finding that the CLC-rent growth association and its racial difference disappear when the sample is restricted to tracts with nearly identical AHBI values or when an alternative measure of market tightness replaces AHBI.
Figures


read the original abstract
The 2024 Department of Justice antitrust complaint against RealPage, Inc. named five major residential REITs for coordinating algorithmic rent pricing across hundreds of thousands of apartment units in major US metropolitan areas. This paper studies whether census-tract-level corporate landlord concentration (CLC), measured from SEC EDGAR 10-K property filings geocoded to census tracts, the first such application in the literature, is associated with rent growth 2019-2023, and whether that association is larger in majority-minority neighborhoods. Rent outcomes are measured using the Zillow Observed Rent Index (ZORI). To account for the possibility that corporate landlords preferentially locate in neighborhoods already seeing rent appreciation, all regressions control for a fully novel Algorithmic Housing Burden Index (AHBI), a composite of pre-existing rent burden and market tightness from ACS data. Across 665 census tracts in ten US metropolitan areas, doubling REIT concentration is associated with 2.8 percentage points higher rent growth (p = 0.086, p = 0.030, HC1 robust). This association is significantly stronger in majority-minority tracts. Within the same metro, high-CLC majority-minority tracts are associated with 5.9 percentage points higher rent growth than comparable white tracts (p = 0.039). An XGBoost model predicts 44 percent of out-of-sample rent growth variance, with SHAP analysis independently confirming that CLC's contribution is positive in minority tracts and negative in white tracts. Taken all together, these findings provide the first tract-level evidence consistent with corporate landlord concentration being associated with disproportionately higher rent growth in communities of color.
Editorial analysis
A structured set of objections, weighed in public.
Referee Report
Summary. The paper claims that census-tract corporate landlord concentration (CLC), constructed from geocoded SEC EDGAR 10-K filings, is positively associated with 2019-2023 rent growth (ZORI) across 665 tracts in ten metros, with the association stronger in majority-minority neighborhoods. After controlling for a novel Algorithmic Housing Burden Index (AHBI) from ACS rent-burden and tightness measures, doubling CLC links to 2.8 pp higher rent growth (p=0.086/0.030 HC1); within-metro high-CLC majority-minority tracts show 5.9 pp higher growth than white tracts (p=0.039). An XGBoost model explains 44% out-of-sample variance, with SHAP values confirming CLC's positive contribution in minority tracts and negative in white tracts.
Significance. If the conditional associations survive stronger identification checks, the work would supply the first tract-level evidence on racial disparities in rent growth tied to algorithmic REIT pricing, using a novel geocoded EDGAR measure of CLC and an out-of-sample ML validation. The within-metro design and SHAP confirmation are constructive elements.
major comments (3)
- [Methods (AHBI)] Methods section on AHBI: the claim that AHBI sufficiently accounts for corporate landlords preferentially locating in neighborhoods already experiencing rent appreciation rests on a static composite of ACS rent-burden and market-tightness measures, yet no equation, weighting scheme, or normalization details are supplied; without these, it is impossible to verify whether AHBI absorbs forward-looking or trending appreciation factors (e.g., 2015-2019 ZORI trajectories).
- [Results (OLS)] Results (OLS and interaction specifications): the headline 2.8 pp coefficient on log(REIT concentration) and the 5.9 pp majority-minority differential are reported with marginal-to-significant p-values, but the manuscript shows no table or appendix with the full covariate vector, variance-inflation factors, or specifications that add pre-period rent-growth trends or local employment shocks to test whether AHBI fully proxies selection.
- [XGBoost and SHAP] Machine-learning validation: the XGBoost model reports 44% out-of-sample variance explained and SHAP values that align directionally with OLS, but without disclosure of the complete feature list (including whether AHBI is among the predictors), cross-validation folds, or hyperparameter tuning, it remains unclear whether the ML exercise provides an independent check on the CLC-rent-growth link or simply reproduces the same potential omitted-variable problem.
minor comments (1)
- [Abstract] Abstract: the phrasing 'p = 0.086, p = 0.030, HC1 robust' is ambiguous as to which specification each p-value refers to; a parenthetical clarification would improve readability.
Simulated Author's Rebuttal
We thank the referee for these constructive comments, which identify important areas for greater transparency in our methods and robustness checks. We address each point below and commit to revisions that provide the requested details without altering the core findings.
read point-by-point responses
-
Referee: Methods section on AHBI: the claim that AHBI sufficiently accounts for corporate landlords preferentially locating in neighborhoods already experiencing rent appreciation rests on a static composite of ACS rent-burden and market-tightness measures, yet no equation, weighting scheme, or normalization details are supplied; without these, it is impossible to verify whether AHBI absorbs forward-looking or trending appreciation factors (e.g., 2015-2019 ZORI trajectories).
Authors: We agree the manuscript omits key construction details for AHBI. In the revised version we will add a new Methods subsection with the precise equation (a weighted sum of standardized ACS rent-burden and tightness variables), the weighting scheme (equal weights after standardization, with robustness to PCA), normalization (min-max to [0,1]), and explicit discussion that all inputs are pre-2019 ACS vintages. We will also note that while AHBI does not directly incorporate 2015-2019 ZORI trajectories, the included demand-pressure proxies are intended to capture selection; we welcome suggestions for further pre-trend controls. revision: yes
-
Referee: Results (OLS and interaction specifications): the headline 2.8 pp coefficient on log(REIT concentration) and the 5.9 pp majority-minority differential are reported with marginal-to-significant p-values, but the manuscript shows no table or appendix with the full covariate vector, variance-inflation factors, or specifications that add pre-period rent-growth trends or local employment shocks to test whether AHBI fully proxies selection.
Authors: We concur that full regression output and diagnostics are needed. The revision will include an appendix table reporting the complete covariate vector for all OLS and interaction specifications, variance-inflation factors (all VIFs < 5 for CLC and AHBI), and two additional robustness columns: one adding pre-period (2015-2019) ZORI growth where coverage exists, and one adding metro-level employment shocks from BLS QCEW data. These checks will be presented on the full sample and the subsample with pre-trend data; we note that ZORI coverage is incomplete for some tracts prior to 2019, which we will document. revision: yes
-
Referee: Machine-learning validation: the XGBoost model reports 44% out-of-sample variance explained and SHAP values that align directionally with OLS, but without disclosure of the complete feature list (including whether AHBI is among the predictors), cross-validation folds, or hyperparameter tuning, it remains unclear whether the ML exercise provides an independent check on the CLC-rent-growth link or simply reproduces the same potential omitted-variable problem.
Authors: We appreciate the request for ML transparency. The revised manuscript will add an appendix detailing the full feature list (all OLS covariates plus additional ACS demographics and metro fixed effects; AHBI is included), the 5-fold cross-validation procedure, and hyperparameter tuning (grid search over learning rate, max depth, subsample, and number of estimators, with final values reported). This documentation will clarify that the exercise incorporates nonlinear interactions and serves as an independent robustness check beyond linear OLS. revision: yes
Circularity Check
No significant circularity; purely observational analysis on external data
full rationale
The paper reports OLS regressions and XGBoost models estimating associations between corporate landlord concentration (CLC, from EDGAR filings) and rent growth (ZORI), with controls including the novel AHBI composite from ACS data. No equations, derivations, or predictions are present that reduce reported coefficients or SHAP values to quantities defined by the fitted parameters themselves. The analysis is cross-sectional and predictive on held-out data but contains no self-definitional steps, fitted-input-called-predictions, or load-bearing self-citations. The central claims rest on external data sources and standard econometric/ML techniques without any reduction to the paper's own inputs by construction.
Axiom & Free-Parameter Ledger
free parameters (2)
- OLS coefficient on log(REIT concentration) =
2.8 pp
- Majority-minority interaction or subgroup coefficient =
5.9 pp
axioms (1)
- domain assumption The Algorithmic Housing Burden Index (AHBI) adequately controls for corporate landlords' preferential location in neighborhoods already experiencing rent appreciation.
invented entities (2)
-
Algorithmic Housing Burden Index (AHBI)
no independent evidence
-
Census-tract corporate landlord concentration (CLC) from geocoded SEC 10-K filings
no independent evidence
Reference graph
Works this paper leans on
-
[1]
Race, profit, and algorithms: Neighborhood-level analysis of iBuyers’ profit margin
Sungwon Byun. Race, profit, and algorithms: Neighborhood-level analysis of iBuyers’ profit margin. Journal of Urban Affairs, 2024
2024
-
[2]
Coordinated vs
Sophie Calder-Wang and Gi Heung Kim. Coordinated vs. efficient prices: The impact of algorithmic pricing on multifamily rental markets, August 2024. SSRN Working Paper No. 4403058
2024
-
[3]
Sant’Anna
Brantly Callaway and Pedro H.˜C. Sant’Anna. Difference-in-differences with multiple time periods. Journal of Econometrics, 225(2):200–230, December 2021
2021
-
[4]
XGBoost: A scalable tree boosting system
Tianqi Chen and Carlos Guestrin. XGBoost: A scalable tree boosting system. InProceedings of the 22nd ACM SIGKDD International Conference on Knowledge Discovery and Data Mining, pages 785–794, San Francisco, CA, 2016. Association for Computing Machinery. 21
2016
-
[5]
The dynamics of housing cost burden among renters in the United States.Journal of Urban Affairs, 2024
Gregg Colburn, Ryan Allen, Kyle Crowder, and Deirdre Pfeiffer. The dynamics of housing cost burden among renters in the United States.Journal of Urban Affairs, 2024
2024
-
[6]
The cost of anticompetitive pricing algorithms in rental housing
Council of Economic Advisers. The cost of anticompetitive pricing algorithms in rental housing. Tech- nical report, The White House, December 2024
2024
-
[7]
The impact of institutional investors on homeownership and neighborhood access, 2023
Joshua Coven. The impact of institutional investors on homeownership and neighborhood access, 2023. SSRN Working Paper No. 4554831
2023
-
[8]
Homeownership, racial segregation, and policy solutions to racial wealth equity
Solomon Greene, Alanna McCargo, and Linna Zhu. Homeownership, racial segregation, and policy solutions to racial wealth equity. Technical report, Brookings Institution, February 2024
2024
-
[9]
Lundberg and Su-In Lee
Scott M. Lundberg and Su-In Lee. A unified approach to interpreting model predictions. InAdvances in Neural Information Processing Systems, volume 30, pages 4765–4774, 2017
2017
-
[10]
Investigation of allegedrentalprice-fixingviaalgorithmiccollusiononRealPageandotherrevenuemanagementsoftware,
Timothy Majidzadeh, Jonathan Chung, Golnaz Moallem, Annie Ni, and Sam Stiles. Investigation of allegedrentalprice-fixingviaalgorithmiccollusiononRealPageandotherrevenuemanagementsoftware,
-
[11]
MIDS capstone project, UC Berkeley School of Information
-
[12]
The racial wealth gap 1992 to 2022, April 2024
National Community Reinvestment Coalition. The racial wealth gap 1992 to 2022, April 2024
1992
-
[13]
How automated valuation models can disproportionately affect majority-Black neighborhoods
Michael Neal, Sarah Strochak, Linna Zhu, and Caitlin Young. How automated valuation models can disproportionately affect majority-Black neighborhoods. Technical report, Urban Institute, December 2020
2020
-
[14]
The market effects of algorithms
Lindsey Raymond. The market effects of algorithms. Working paper, 2024
2024
-
[15]
Institutional owners in single-family rental properties
Urban Institute, Housing Finance Policy Center. Institutional owners in single-family rental properties. Technical report, Urban Institute, 2023
2023
-
[16]
Reducing the racial homeownership gap
Urban Institute, Housing Finance Policy Center. Reducing the racial homeownership gap. Technical report, Urban Institute, 2024
2024
-
[17]
Census Bureau
U.S. Census Bureau. American community survey 5-year estimates, 2019, 2020. Tables B25003, B25070, B25002
2019
-
[18]
Census Bureau
U.S. Census Bureau. 2020 census tract to 2010 census tract relationship files, 2021
2020
-
[19]
Department of Housing and Urban Development, Office of Policy Development and Research
U.S. Department of Housing and Urban Development, Office of Policy Development and Research. HUD-USPS ZIP code crosswalk files, 2019. Q4 2019 release
2019
-
[20]
Department of Justice, Antitrust Division
U.S. Department of Justice, Antitrust Division. United states and plaintiff states v. RealPage, Inc., August 2024. Civil complaint, U.S. District Court for the Middle District of North Carolina
2024
-
[21]
Department of the Treasury, Office of Economic Policy
U.S. Department of the Treasury, Office of Economic Policy. Racial differences in economic security: Housing. Technical report, U.S. Department of the Treasury, December 2022
2022
-
[22]
Securities and Exchange Commission
U.S. Securities and Exchange Commission. EDGAR full-text search system. 10-K annual filings, Sched- ule III - Real estate and accumulated depreciation, fiscal years 2016-2022
2016
-
[23]
How a secret rent algorithm pushes rents higher, October 2022
Heather Vogell. How a secret rent algorithm pushes rents higher, October 2022. ProPublica
2022
-
[24]
Methodology: Zillow Observed Rent Index (ZORI), 2023
Zillow Research. Methodology: Zillow Observed Rent Index (ZORI), 2023
2023
-
[25]
first factor
Zillow Research. Zillow observed rent index (ZORI): Smoothed, seasonally adjusted, all homes plus multifamily, 2023. ZIP code-level monthly data, January 2014-December 2023. 22 Appendix A - Raw Winsorized CLC Robustness Check The primary specifications throughout this paper use the log-transformed measurelog(1 +CLC)rather than raw winsorized CLC for two r...
2023
discussion (0)
Sign in with ORCID, Apple, or X to comment. Anyone can read and Pith papers without signing in.